An additional note is necessary for technical readers of this
article, regarding the drag computed for the Tomahawk cruise missile.
The question may reasonably be asked whether the guaranteed cruise
thrust given by Williams for the F107R engine necessarily equals the thrust
required to fly at that speed and atmospheric condition.
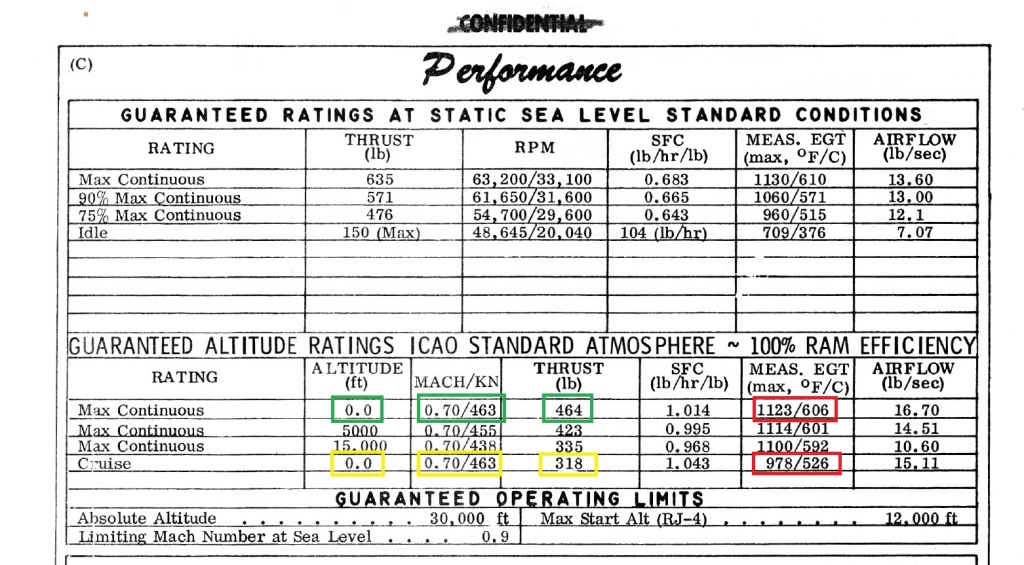
Our analysis has assumed that the cruise drag does equal the guaranteed engine thrust at the given condition by the engine manufacturer [0 ft altitude; M 0.7 flight speed]. But this assumption may not necessarily be valid. For instance, we see on the engine performance data from Williams, that a much higher thrust, 464 lbf is available at the same flight condition under full engine power, as seen in the chart.
We see here that the cruise thrust in yellow is 318 lbf, while the
maximum continuous engine power at the same flight condition [0 ft altitude; M
0.7] produces 464 lbf of thrust [green].
It means the actual engine thrust required to push that T-Hawk
through the air at the given flight condition could, conceivably, be somewhere
between those two parameters. Now it is necessary to point out that at its cruising
condition, the missile must have reserve engine power in store—in order to
climb to avoid obstacles or rising terrain, and in order to turn, since turning
flight requires greater engine thrust if airspeed in the turn is to be
maintained.
[The parameter highlighted in red is the exhaust gas temperature at the respective engine power settings. We see that the lower EGT in cruise indicates lower engine rpm.]
It is therefore necessary to cross-check our assumption of cruise thrust being equal to the missile drag, by means of accurate data for the actual drag of the missile.
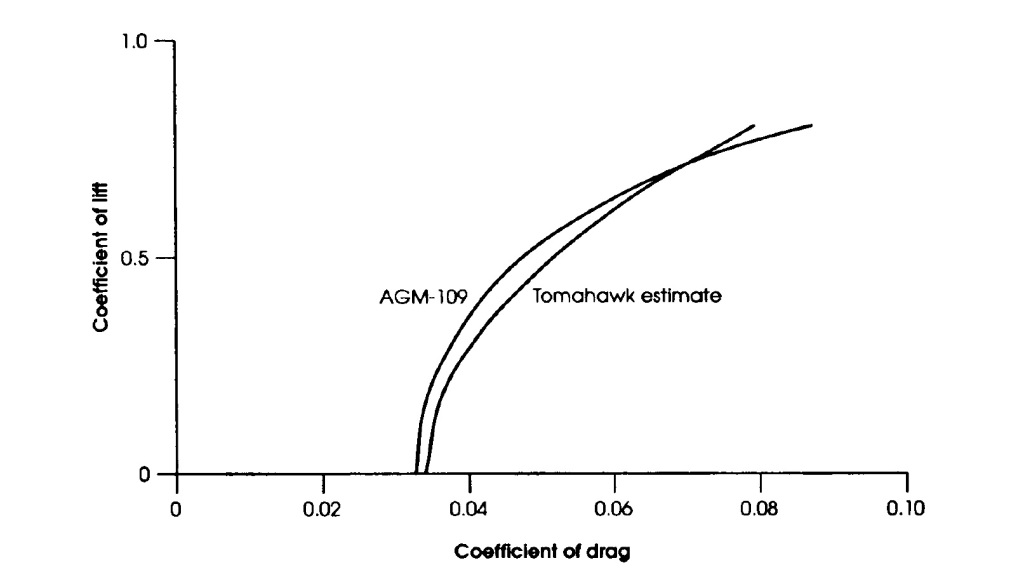
Such data is generally obtained only after actual flight testing, and has in fact been published. In Technology Advances in Cruise Missiles, published by the AIAA in 1981 and authored by B. J. Kuchta, an engineer with General Dynamics, the original developer and manufacturer of the Tomahawk, a drag polar is given.
As well, a comprehensive technical analysis of the T-Hawk was published in 1992, in the journal Global Security, authored by MIT physicists Theodore A. Postol and George N. Lewis, Long Range Nuclear Cruise Missiles and Stability.
In that paper the authors compute their own coefficient of drag estimate on the Tomahawk, based on a rigorous aerodynamic analysis known as a drag build-up technique.
Below is a graph from that paper [page 78] showing the results compared to the Kuchta data:
We see that the respective drag polar curves match very closely, with the Postol-Lewis estimate giving a slightly higher drag and hence slightly lower lift to drag ratio, in flight regimes up to a lift coefficient [CL] of about 0.7 in comparison to the Kuchta data.
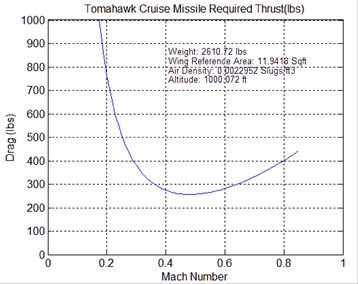
Professor Postol has sent me two additional graphs based on plots of their drag computation from the 1992 paper:
The above plot shows the thrust required for the T-Hawk at flight
speeds from just below M 0.2, to just above M 0.8—at a flight weight of 2,610
lbm, altitude of 1,000 ft, and air density of 0.0023 slugs per cubic foot
[1.183 kg/m^3]. This air density indicates a temperature 3 degrees C above ISA
standard.
We see from the plot that the missile drag [and therefore thrust required] at flight speed M 0.7 is about 350 lbf, about 30 lbf higher than the thrust required used in my analysis based on the published engine thrust data.
This plot is based on the coefficient of drag [CD] estimate computed by profs Lewis and Postol in their 1992 paper, and expressed in the standard form [page 78 from above paper]:
CD = 0.034 + 0.071 CL^2[Equation 1]
Where the first term on the right-hand side is the zero lift drag coefficient [CD0] and the second term is the lift induced drag, which is a function of lift coefficient squared.
Using the Lewis-Postol data for missile weight and CD, and a flight speed of M 0.7, 0 ft altitude, and standard ISA conditions [as in our reference analysis], we arrive at the following drag numbers:
This result gives a slightly higher drag than our assumed drag based on the published engine data. The resulting drag area is thus greater by about 10 percent, so our drag area of the Quds, which we scaled to the T-Hawk is also higher by a similar amount.
Assuming again that the Quds-1 has half the drag of the T-Hawk [instead of 0.43, as scaled linearly by fuselage section area], it means the Quds-1 would have a drag area of 0.24 ft^2, instead of 0.22 ft^2.
This assumption of drag, based on the Lewis-Postol drag computation does not change the end result significantly—the Quds-1 still has more than enough range to strike Abqaik from Houthi territory.
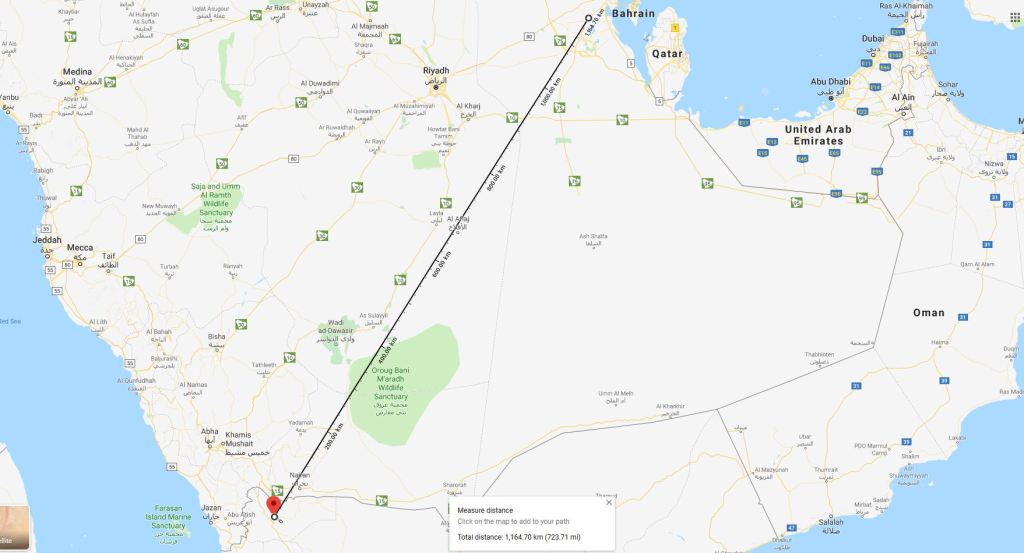
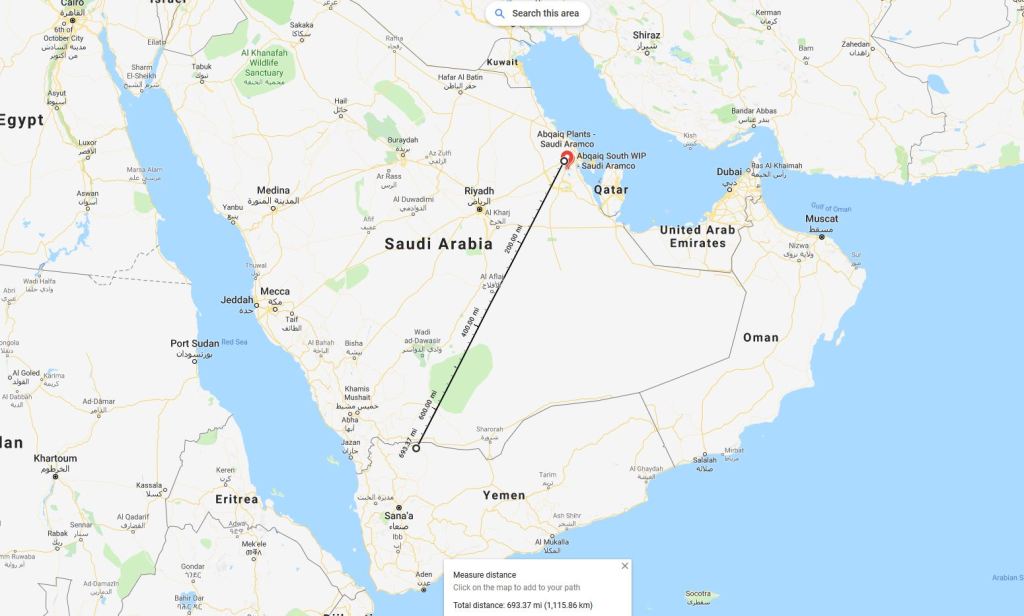
For instance, we note that the flight distance from the northern Houthi city of Saada to Buqayq, Saudi Arabia is actually 1,165 km. The Houthis control considerable territory to the north and east of Saada, a city of one million, and could thus launch missiles from even closer range, about 1,100 km.
Flight Distance from Saada, Yemen to Buqayq, Saudi Arabia: 1,165 km Flight Distance from Houthi-Controlled Territory in North Yemen, to Aramco Abqaik: 1,116 km [693 miles]
Quds-1 Fuel Capacity
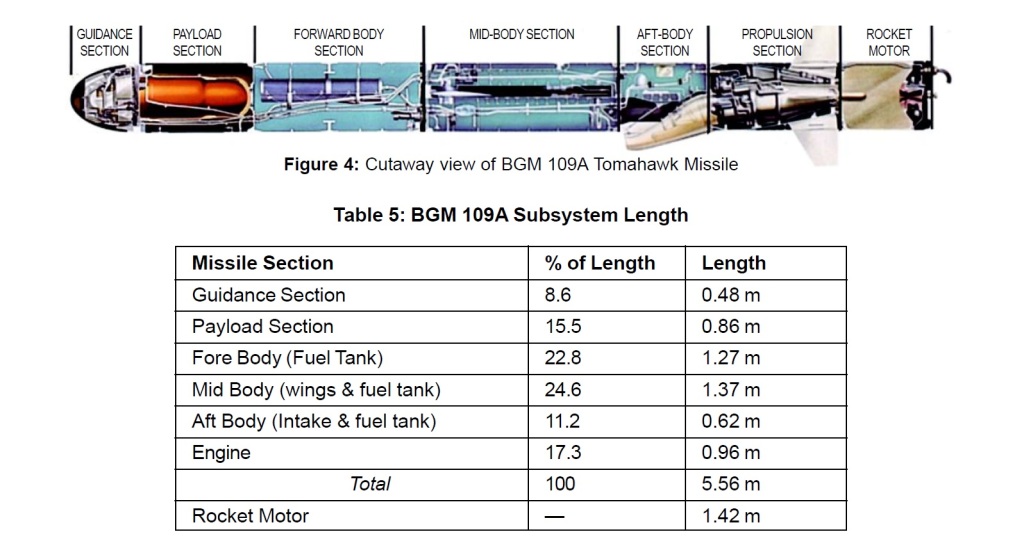
There are some additional aspects of the Quds analysis to consider, specifically with regards to the fuel capacity. Below is a cutaway illustration of the Tomahawk cruise missile, showing the fuel tank sections:
Source: An Assessment of Pakistan’s Babur HATF 7 Cruise Missile, Global Security 2007
We see that the T-Hawk Fuel tank comprises three fuselage sections, fully 59 percent of the total missile length, 10.7 ft. Our initial assessment of the fuel tank length of the Quds-1 of 6.5 ft may be considerably less than its actual length.
At least part of the aft-body section on which the TJ-100 engine is mounted could in fact be part of the fuel tank. We will need to perform a more precise scaling from the Quds photos. The result could be more fuel capacity than originally estimated.
Additional Reports From Media
Military experts believe Iranian-made drones set off from Yemen to strike Aramco
Rai al-Youm daily, 17 Sept 2019
Former British diplomat Alastair Crooke has conveyed this report, which has been picked up by Colonel Pat Lang’s blog.
The military commanders in the USA are keeping silent with regards to the source of the attacks that targeted the Aramco oil facilities last Saturday and that caused some serious damages there. It seems that the Houthis have used Iranian-made modern drones and that a commando unit from Saudi land served to steer the drones at the last few minutes prior to the strikes.
The odd part consists of the silence of the American military commanders. Indeed, there has been no official report released by the Pentagon that accuses Iran. Furthermore, no senior military officers made any statements to accuse Iran.
The senior officers and military experts are actually cautious and not taking the risk of making any incorrect statements. They realize that the arsenal of the American radars at the Arabian Gulf including the land and the ship-mounted radars have recorded at least half the drones’ flight, which is enough data to tell the source.
I had noted in my original analysis below:
No actual expert in aerodynamics and jet propulsion could possibly arrive at such a ridiculous figure [700 km range for Quds-1]. It would require an engine fuel consumption of DOUBLE that of the actual TJ-100 engine.
In an earlier note to Prof Postol, I wrote:
I have to believe that serious technical people within the defense establishment are cognizant of the fact that the Quds has twice the range being cited by bogus experts, and that it did indeed come from Yemen.
Some Technical Notes on Drag Analysis
In Equation 1 we see the numbers arrived at by Profs Lewis and Postol for the Tomahawk.
CD = 0.034 + 0.071 CL^2[Equation 1]
As noted already, this is the result of a drag build-up procedure that is widely used in industry by aerodynamicists to predict the drag of an aircraft or other flight vehicles, during the design process.
The techniques employed in industry are quite sophisticated [and often proprietary trade secrets] and can achieve results within 99 percent accuracy of the finished and flight tested aircraft.
The above numbers for the Tomahawk represent a computed figure for zero lift drag coefficient CD0, plus lift-induced drag coefficient CDi—thereby representing the entire drag coefficient of the vehicle, CD.
CD = CD0 + CDi
We note that CDi is the total lift-induced drag coefficient, and includes additional parasite drag due to lift [such as the extra profile drag on both wing and fuselage that results from an aircraft pitched up to a high angle of attack at high lift, thus presenting a greater sectional area to the airstream].
The lift-induced drag coefficient CDi can be further broken down into its constituent components and the above equation can be stated as:
CD = CD0 + CL^2 / π / e / AR
Where CL is the lift coefficient
eis the Oswald Efficiency Factor, which
takes into account the extra parasite drag due to lift.
And AR is the wing aspect ratio, which is the ratio of the
wing span squared, divided by wing area.
Since we know the aspect ratio of 6, the value of pi, and the value
of the second constant in Equation 1, we can solve for the Oswald efficiency
factor that is implicit in the constant in the second term of equation 1.
Setting the CL to unity, the Oswald efficiency factor is then:
e = 1 / 3.14 / 6 / 0.071 = 0.742
Where 0.071 is the constant in the second term of equation 1.
Looking at these results of the Lewis and Postol drag build-up, as expressed in Equation 1, we see that the zero lift-drag coefficient of 0.034 as well as the Oswald factor implicit in the constant of 0.071 appear to be in close proximity to what flight tests of the Tomahawk-type flight vehicle would be likely to confirm.
On September 14, 2019, the world’s largest crude oil processing facility at Abqaik, Saudi Arabia was struck by multiple airborne strikes that caused massive damage to key facilities known as oil stabilization plants, which make crude oil safely storable and transportable.
The reports and images from the scene pointed to severe damage that reportedly cut the oil processing output of the kingdom by no less than half—amounting to a loss of about five million barrels per day, about five percent of the world’s oil supply. As of Sept. 21, the consensus reported in the media is that the facility was attacked by 18 drones and seven cruise missiles, as reported by Fox.
The Yemeni Ansar Allah, aka Houthi rebel movement immediately claimed responsibility for the airstrike, but this claim is universally dismissed by so-called ‘experts’ and ‘analysts’ in the western media. The consensus argument is that the Houthi aerial weapons simply do not have the range to strike at that distance, about 1,200 km, or 750 miles.
Notably, no technical analysis of any kind has been published by qualified aeronautical professionals to support this assertion. For instance, the website Arms Control Wonk, which is widely cited in the media on various armaments issues, concluded that, it’s ‘unlikely’ the Quds-1 range would be ‘anywhere close’ to reach the struck KSA target from Yemeni territory.
It is necessary to point out that the author of this widely-cited ‘analysis’ lists no aeronautical engineering credentials, nor makes any attempt at a bona fide quantitative technical analysis. It is simply an opinion based on no scientific analysis whatsoever.
The following technical analysis will establish, based on accepted principles of physics and aeronautics, that the Quds-1 is indeed capable of a flight range in excess of 1,200 km—capable to hit Abqaik from Houthi territory.
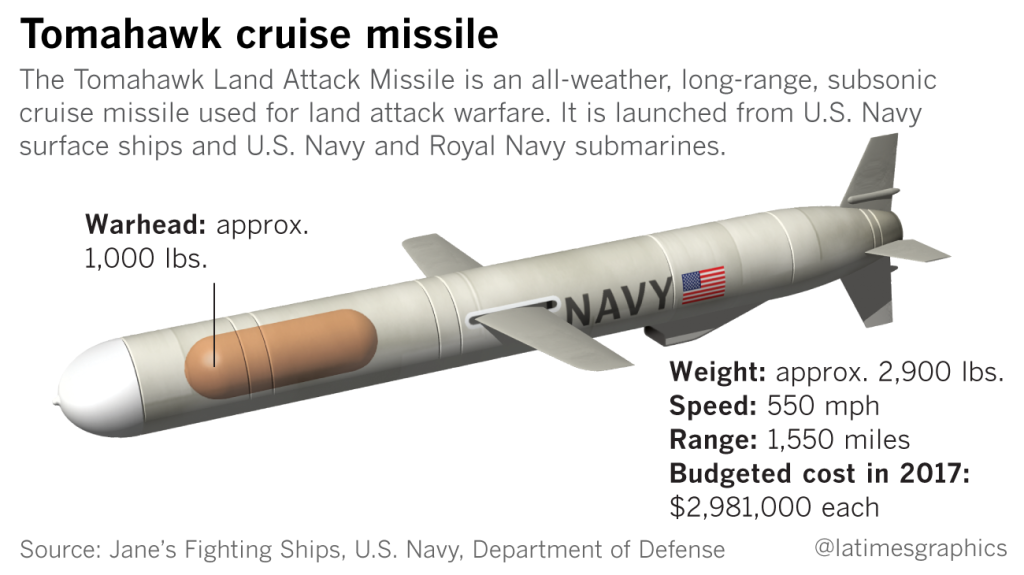
The Benchmark:
Raytheon ‘Tomahawk’ Land Attack Missile
In this analysis, we will proceed to rely on the known characteristics of the Tomahawk, such as its physical dimensions, engine thrust and fuel consumption in cruise, in order to determine the same parameters for the Quds-1.
We will compute the key aeronautical parameter for the Tomahawk, its aerodynamic drag, relying on engine manufacturer information for its cruise thrust and fuel consumption.
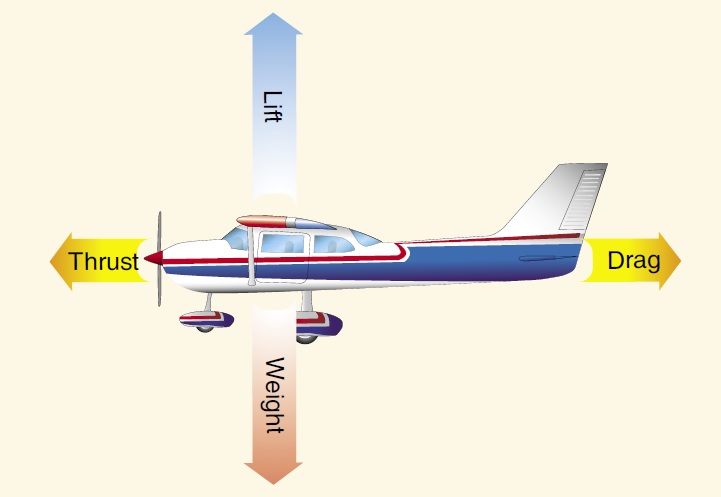
The basic physical principle is that thrust must equal drag in straight and level, unaccelerated flight, as per the action-reaction principle.
Thus, knowing the engine thrust of the missile in cruise, we also know its drag.
The published engine data for the Tomahawk engine includes cruise thrust and fuel consumption. It means the analysis can accurately determine the drag of the T-Hawk.
We will do the same for the Quds-1, which uses a Czech-built turbojet engine whose technical characteristics and specifications are readily available from the manufacturer.
Looking at the Tomahawk we note that it has a cylindrical fuselage supported by fairly small wings, as well as a cruciform tail section with movable surfaces for flight maneuvering. It is readily apparent that such a sleek and streamlined shape will generate minimal drag, or air resistance.
The main source of drag for such a flight vehicle will be the cross-sectional area of its fuselage—think of a wide-body passenger jet, which will have greater drag than a narrow body airliner. This is called form drag. In addition, skin friction drag is also obviously dependent on the size of the flight vehicle and its wetted surface area. Form drag and skin friction drag together constitute the entire parasitic drag of a flight vehicle.
Cruise missiles are designed to fly fairly low to the ground or sea in order to avoid detection by enemy air defense radar. At these low altitudes the air is dense, and the missile is designed to fly at high speeds; this means that a small wing will produce enough lift to keep the craft aloft.
By contrast, a passenger jet flying at high altitudes in thin air requires a much bigger wing to support its weight.
Since the two cruise missiles under comparison have the same basic layout, their respective aerodynamic drag will be linearly proportional to their respective fuselage cross-section areas—which in turn are a function of fuselage diameter.
Tomahawk Dimensions:
Diameter: 20.4 inches [0.52 m]
Length: 18 ft, 3 in [5.56 m]
Wingspan: 8 ft, 9 in [2.67 m]
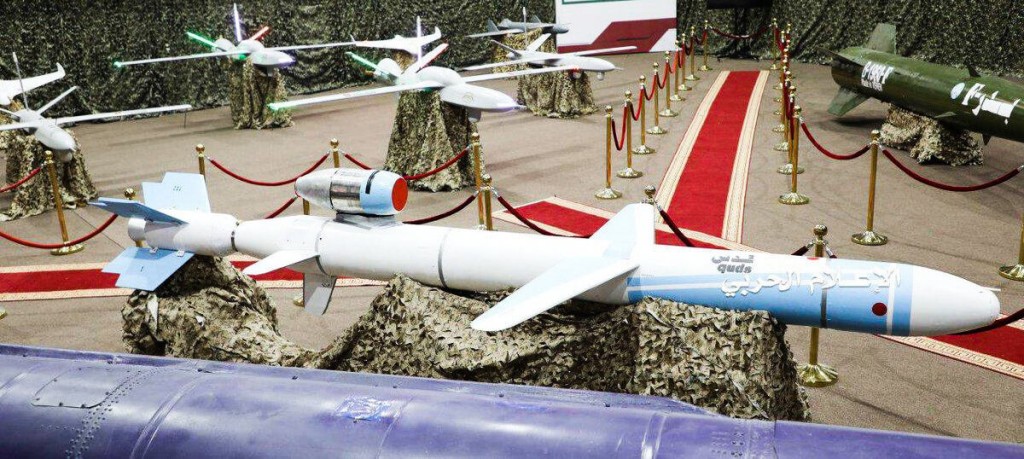
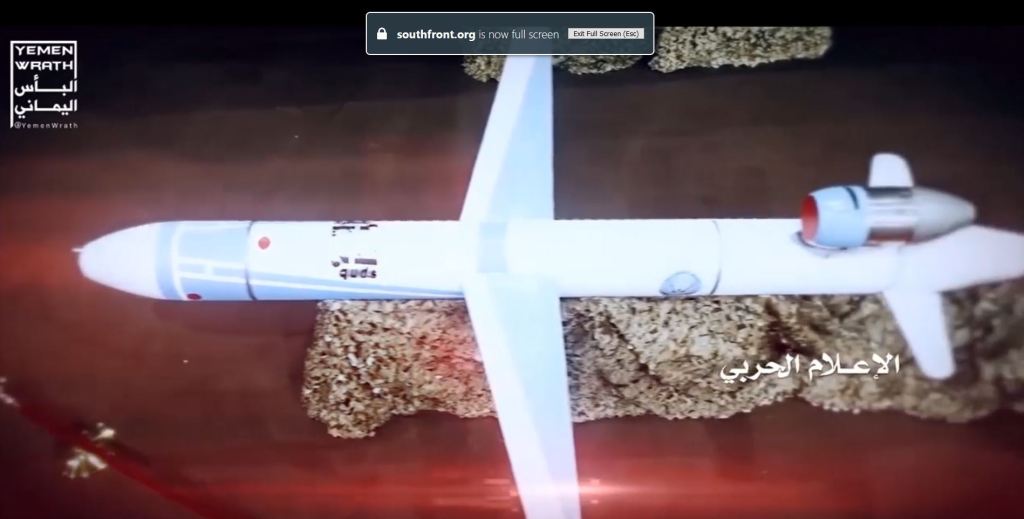
Quds-1 Dimensions
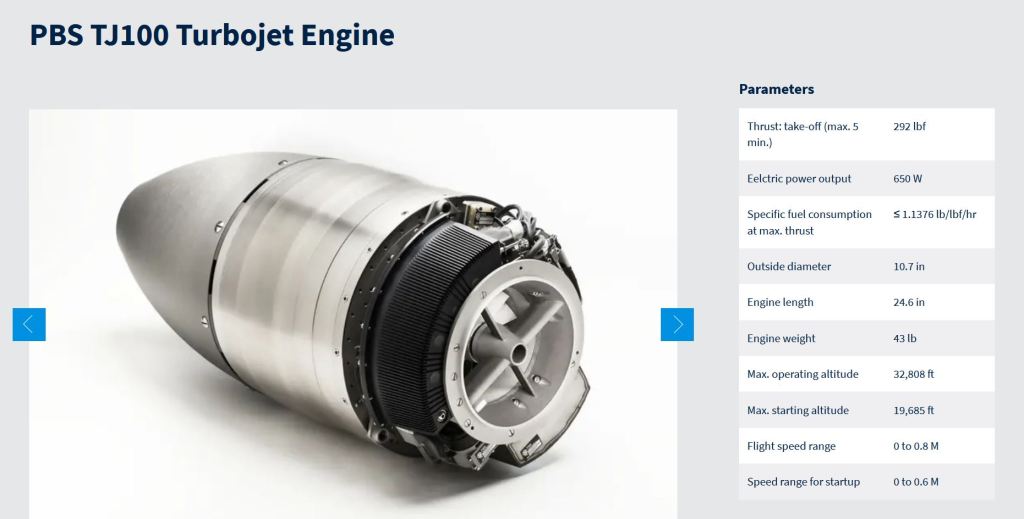
The Houthis have not released any dimensions or specifications for the Quds-1 cruise missile. However, it is possible to accurately estimate key dimensions from published photos, by scaling to the known dimensions of the Quds-1 engine, which is the TJ-100 turbojet, manufactured by PBS Aerospace in Czechia.
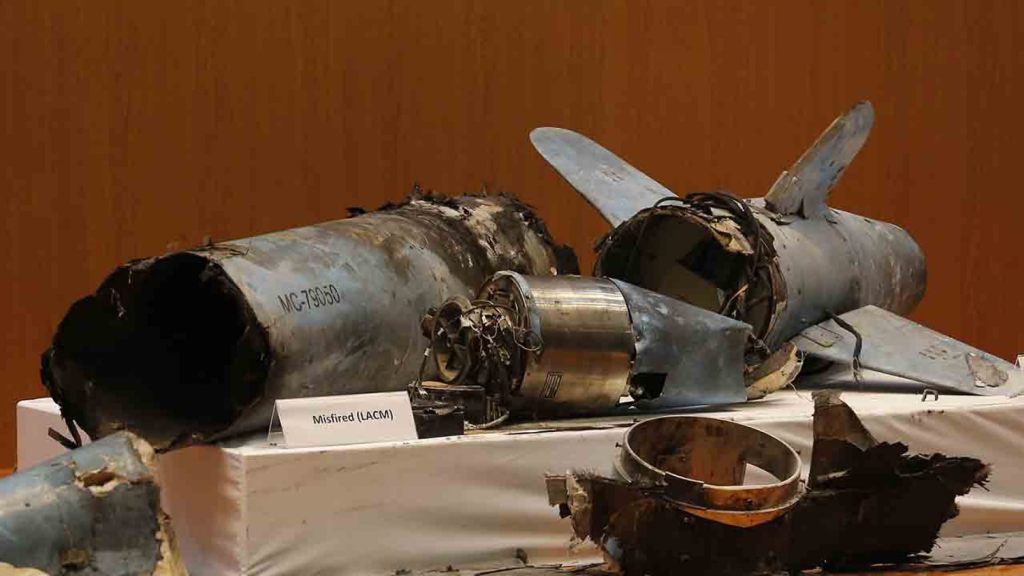
The Saudis reportedly recovered wreckage in June, 2019 of a TJ-100 engine, following a Houthi airstrike that month on the Abha airport, and displayed photos of the engine to the media. The missile in that particular attack was not the Quds-1, but another Houthi cruise missile type, called the Ya Ali. It does confirm however, that the Houthis have access to the TJ-100 engine.
Four days after the Abqaik attack the Saudis displayed wreckage of cruise missile pieces that show what appears to be two TJ-100 engines, as well as airframe pieces, including a nearly intact empennage that bears a strong similarity to Quds-1:
Wreckage displayed by KSA shows TJ-100 engine and empennage and fuselage pieces of Quds-1
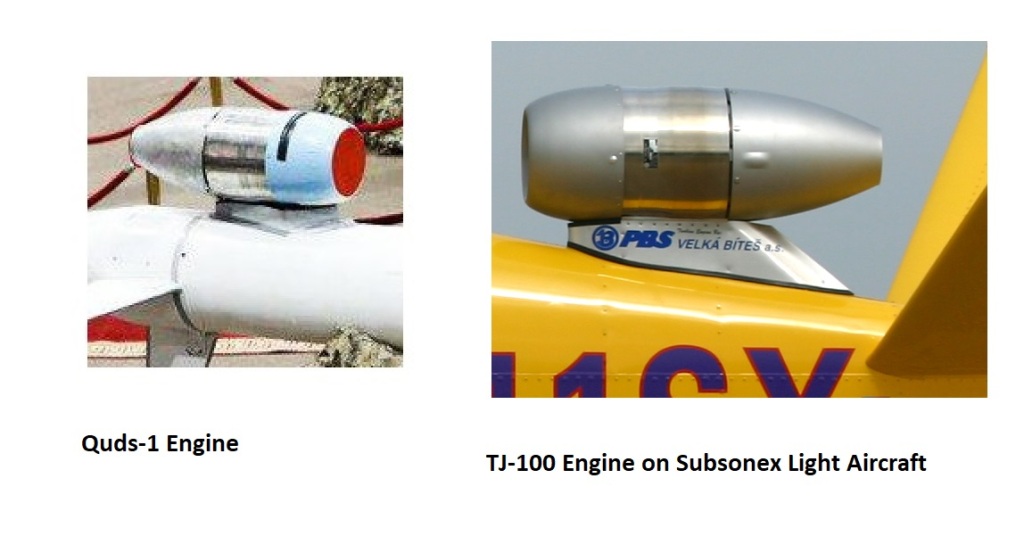
Just by looking at the Quds-1 engine from photos released by the Houthis, and comparing to the TJ-100 we see that it is almost certainly the same engine, or a copy thereof.
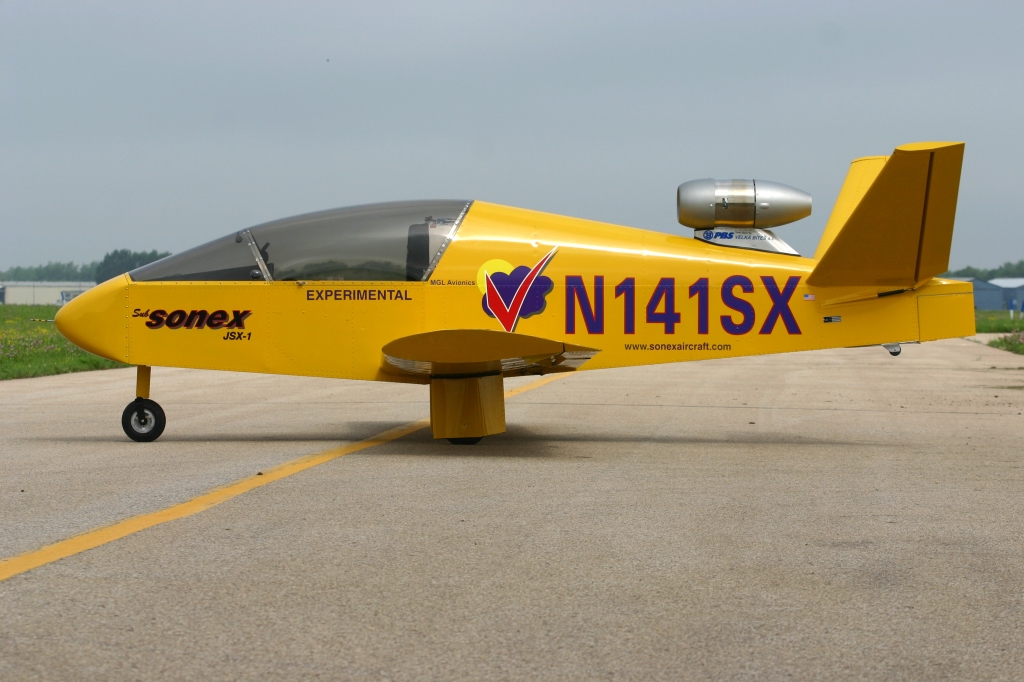
A photo of the TJ-100 mounted on a Subsonex, single-seat homebuilt aircraft
We see from the above comparison pictures that the only difference is a slightly longer engine inlet nacelle on the Quds, compared to the Subsonex aircraft. This is due to the fact that the missile flies at a much higher speed than the small piloted airplane—about double. This requires a more gradual diffusion in the engine inlet, whose purpose is to recover as much ram pressure as possible.
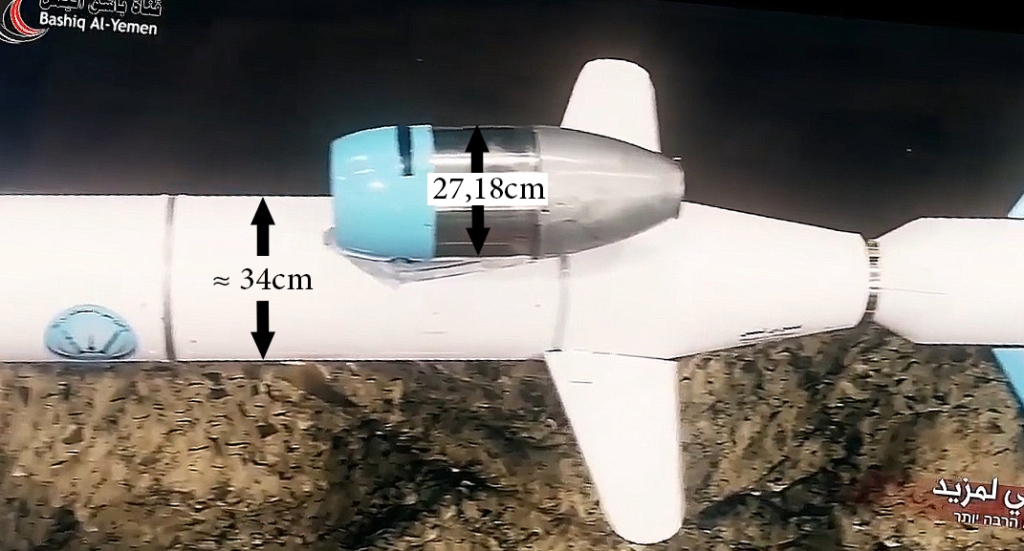
Scaling from the known TJ-100 engine diameter of 10.7 inches [0.27 m], it’s possible to give a good estimate of the crucial Quds-1 fuselage diameter, which, in turn, will let us compute its drag, by direct comparison to that of the Tomahawk.
In this photo from the Arms Control Wonk website, we see the scaling measurements performed on the photo, resulting in a fuselage diameter of approximately 13.4 inches [0.34 m]. This scaling measurement appears accurate.
Computing Cruise Missile Drag
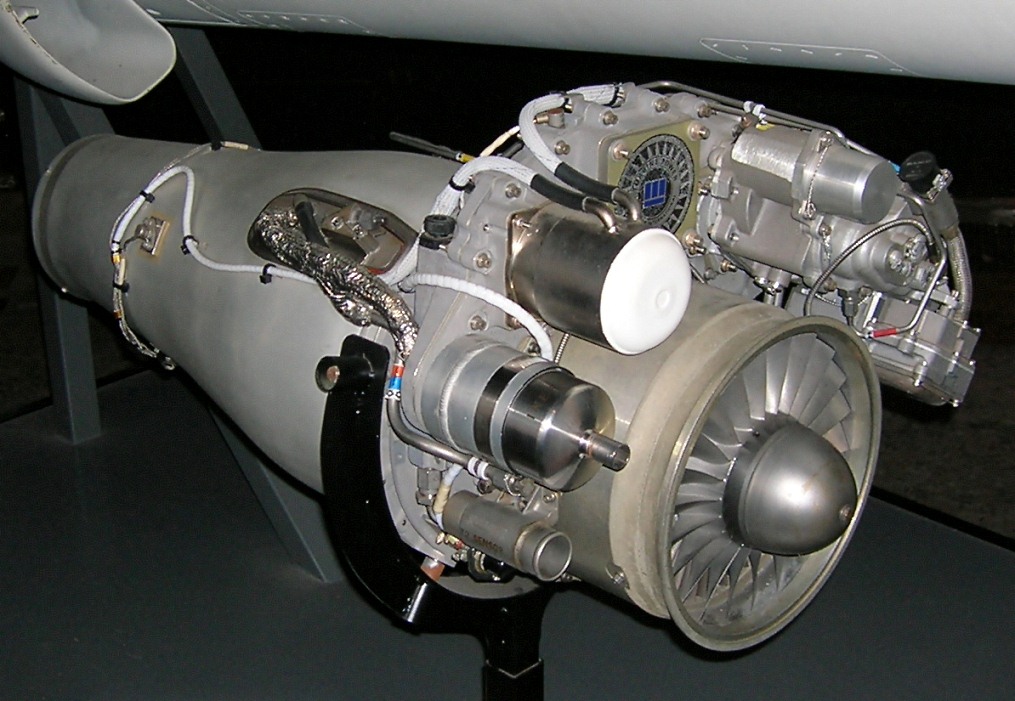
The Tomahawk cruise missile is powered by a small turbofan engine from Williams International, the F107.
Williams F107 turbofan engine
The manufacturer data sheet for this engine is available here:
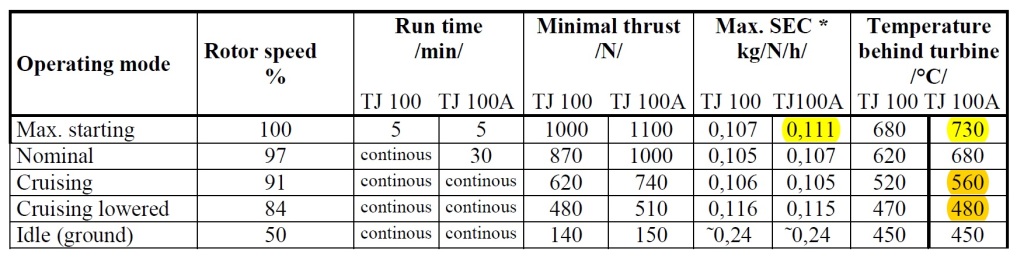
The static thrust of this engine is 635 lbf [pounds of force], a little over twice the rated static thrust of the current TJ-100, at 292 lbf. However, we will assume the use of the earlier version TJ-100A, which was rated at 247 lbf of static thrust.
It is important to note that we are concerned with the engine thrust at the missile’s operational cruise speed and altitude, which values are highlighted in the table—not the static thrust, which is of no use in computing aerodynamic drag [since there is none when standing still.]
Using this information, we can compute the Tomahawk’s total flight drag, which must be equal to the engine thrust, in straight and level, unaccelerated cruise flight.
We note that the F107 engine thrust is 318 lbf at an altitude of sea level [SL; 0 ft] and standard day conditions, at a flight speed of Mach 0.7, which is 463 knots or 533 mph.
That means the Tomahawk’s total drag must also equal exactly 318 lbf, since the two opposing forces must be in equilibrium.
We now need to find the air resistance at this speed and altitude, which is called dynamic pressure. This is the force you feel when you stick your hand out the window while driving on the highway. Dynamic pressure is the product of air density and velocity squared, divided by two.
Standard day air density is 1.225 kg/m^3, the flight speed of 533 mph is 238 m/s [meters per second], so the dynamic pressure works out to ~35 kPa, which is 726 lbf/ft^2. [A good atmospheric calculator here.]
Now that we know that one square foot of flat surface area, pushing through the air at 533 mph and oriented with its flat side perpendicular to its direction of flight, has an air resistance of 726 lbf, we can compute the Tomahawk’s actual drag area by dividing our engine thrust of 318 lbf, by the dynamic pressure. We get a drag area of 318/726 = 0.44 square feet.
Computing the Quds-1 Drag
Since the drag of the two missiles is largely a function of their respective cross-sectional areas, we compute the Quds-1 drag by scaling to the now known drag area of the T-Hawk of 0.44 ft^2.
The Tomahawk with a diameter of 20.4 inches has a cross-section area of 2.3 sq ft. The 13.4-inch diameter Quds has a cross section area of 0.98 ft^2—just 43 percent of the area of the larger T-Hawk [area is a function of the square of diameter].
It’s like comparing a Boeing 737 to the wide-body triple seven; the larger airplane will obviously have more drag, and will therefore need more powerful engines that produce more thrust, and burn more fuel.
We note that the Quds has its engine mounted on top of the fuselage, which will add a little extra drag, compared to the T-hawk’s fuselage-buried engine, with just a small air inlet scoop underneath. [Although the underslung air scoop will be less efficient in terms of ram pressure recovery and will reduce engine performance in comparison to a conventional inlet nacelle that gives a straight path to the engine compressor.]
To compensate for this extra drag, let’s assume that the Quds has 50 percent of the drag of the T-Hawk instead of 43 percent. This means it would need half the thrust to match the T-Hawk’s performance of 533 mph.
However, it is not necessary for the Quds to fly at over 500 mph. The TJ-100A engine is approved for speed up to Mach 0.8, but if we assume a speed of 425 knots true airspeed [M0.64; 489 mph], which is still very fast, the Quds will face lower air resistance, due to the lower dynamic pressure. We note from the math for dynamic pressure that it is a function of velocity squared, so lowering the speed will lower the air resistance quadratically.
Working out the numbers we find that the dynamic pressure at 489 mph [M0.64; 425 knots], sea level, standard day is just 612 lbf/ft^2 [pounds force per square foot], more than 100 lbf/ft^2 less the T-Hawk’s air resistance of 726 lbf/ft^2, flying at 533 mph under the same conditions.
With the Quds drag area being not more than half of the T-Hawk, this equates to a Quds-1 drag area of just 0.22 sq ft; total drag force is then 0.22 ft^2 * 612 lbf/ft^2 = 135 lbf. Since thrust must equal drag, it means that only 135 lbf of thrust is required from the TJ-100 engine for this missile to fly at 489 mph, at sea level standard day conditions.
We see that the smaller fuselage of the Quds, plus a flight speed just 44 mph slower results in thrust required of less than half of that of the T-Hawk.
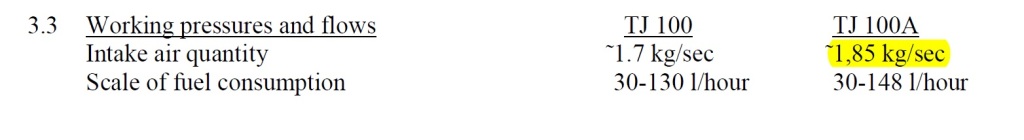
TJ-100 Fuel Consumption
The TJ-100A specific fuel consumption [SFC] is given by the manufacturer as 0.111 kilograms of fuel, per newton of thrust per hour, which is 1.09 pounds of fuel per pound of thrust per hour [lbm/lbf/hr].
However, this figure is at the static condition, which means the aircraft is standing still. As forward speed increases in any aircraft, the thrust decreases, due to the fact that the speed of the aircraft is subtracted from the speed of the jet flow exiting the engine, which remains about the same.
The thrust force of a jet engine is the air mass flow through the engine, times the speed of that gas flow as it exits the engine jet nozzle. The Thrust Equation tells us that as the speed of the aircraft increases, the thrust must decrease.
What this means for fuel consumption is that less thrust is being generated in flight, for the same amount of fuel burn; as the aircraft flies faster thrust continues to decline. This holds true for any aircraft, due to basic physical principles.
We note in the performance Chart from Williams that the T-Hawk engine has a 52 percent higher specific fuel consumption in cruise than it does at maximum power static [1.043 lbm/lbf/hr / 0.683 lbm/lbf/hr = 1.52].
Does that mean the TJ-100 will also see about a 50 percent increase in SFC in cruise flight? The rule of thumb answer is ‘yes,’ but we will verify this by performing a mathematical computation known as a thermodynamic cycle analysis, which is used in jet engine design to determine the optimal general characteristics of the engine, such as mass flow, compressor pressure ratio, thrust, and fuel consumption, both in static condition, but especially at the design point flight airspeed and altitude.
In this case, we will be using the cycle analysis method to first determine some key unknown characteristics of the engine at its static condition, such the compressor pressure ratio, and the combustion chamber temperature.
We know from the above chart the engine’s static thrust of 1100 newton [N], its specific fuel consumption at maximum static power of 0.111 kg/N/hr [1.09 lbm/lbf/hr], and the turbine outlet temperature of 730 C. The below chart gives the air mass flow of the engine as 1.85 kg/s [4.08 lbm/s]. This is sufficient data to accurately compute the engine fuel consumption in flight, at various airspeeds.
The information from the above and below charts is from the TJ-100 manufacturer’s published data, available here.
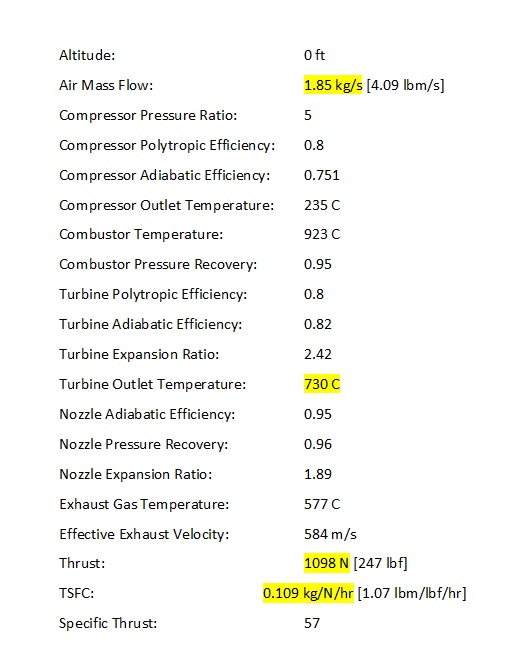
The results of the cycle analysis provide the following engine parameters at the static condition:
We see that our cycle analysis matches the manufacturer’s published engine specifications very closely, to within rounding error for three significant digits. The highlighted parameters are an exact, or almost exact match to the above TJ-100A charts.
Having found the key unknown engine parameters of compressor
pressure ratio, combustion temperature and the component efficiencies of the
compressor, turbine, nozzle and combustor, we can now proceed to compute the
engine’s performance parameters at cruise condition.
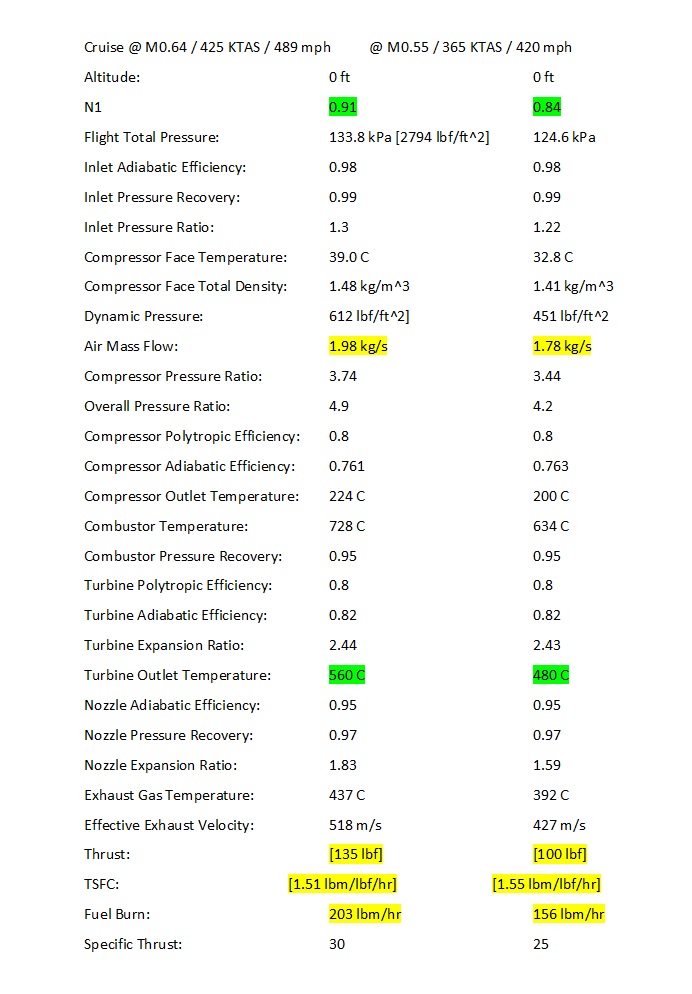
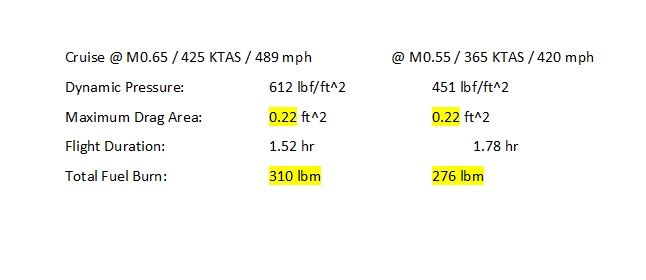
The cruise condition corresponds to an ISA standard atmosphere and 0 ft altitude; two cruise cycle analyses have been computed: one corresponding to the manufacturer chart for 91 percent of rotor speed [N] and another at reduced cruise power engine speed of 84 percent of N.
These two cruise speeds correspond to the below flight speeds of the Quds-1.
The two cruise cycle analysis parameters are as follows:
Again, we note that the key parameters of turbine outlet temperature [highlighted in green] exactly match the manufacturer data.
Now let us compute how much fuel is required to fly a 1,200 km mission [746 statute miles]:
We note that the maximum drag area for both flight speeds matches the computed drag area for the Quds missile.
We now also know the total fuel consumption for a 1,200 km flight—based on the flight speed times the flight duration needed to cover that distance. The only question that remains is whether the Quds-1 is capable of carrying enough fuel.
The
Quds-1 Fuel Capacity
Knowing the diameter of the Quds-1 fuselage, it is necessary
to ascertain the position and length of the fuel tank. In any aircraft, the
position of the fuel tank[s] is centered in close proximity to the aircraft’s
center of gravity, in order to maintain the craft’s crucial balance in flight,
as fuel burns off and weight is shed from the aircraft in flight.
Since the amount of fuel carried by aircraft is a significant proportion of total weight [typically between one quarter and one half for most jet aircraft] the placement of the fuel tanks to maintain balance is vital. In passenger jets and combat aircraft the fuel is usually located in tanks within the wings, as well as the fuselage center section where the wing is attached.
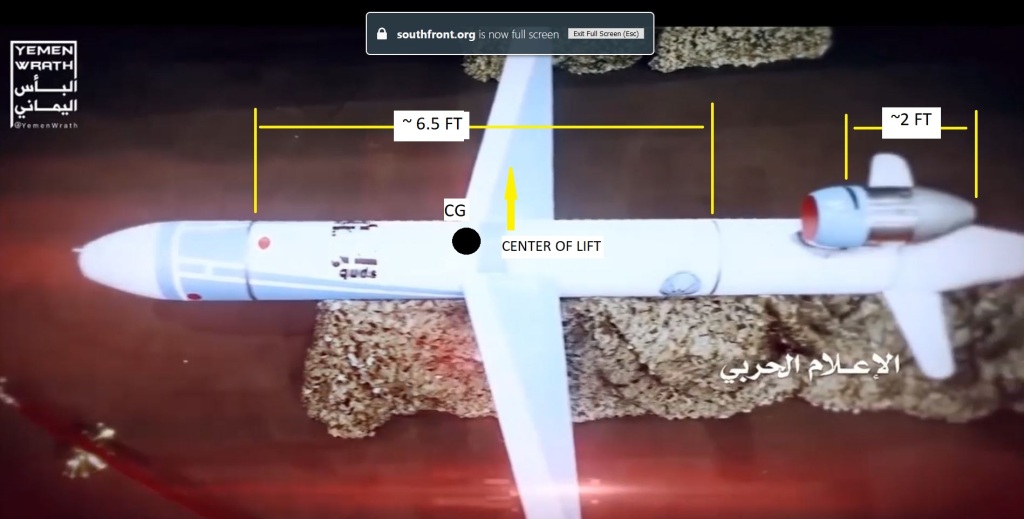
In a cruise missile the wings cannot carry fuel due to their small and thin dimensions; the fuel tank must always be located in the cylindrical fuselage and centered very close to the center of gravity, which, in turn, will be located just ahead of the wing center of lift which is located at about the one quarter-chord point of the wing.
[The CG must be ahead of the center of lift, or neutral
point, for positive aircraft pitch stability. Aerodynamically, a cruise
missile is actually more of an aircraft than a ‘missile.’]
This marked up image of the Quds-1 shows the location of the fuel tank section.
Again, we scale from the known length of the TJ-100 engine which is about 2 ft [not including the inlet nacelle.] We see that the fuel tank section is at least 6.5 ft in length.
This dimension allows us to easily compute the internal fuel tank volume, which works out to about 6.4 cubic feet [180 liters; 48 US gallons]. The weight of aviation kerosene on which turbine aircraft run is somewhat variable within a narrow range, but the ‘standard’ weight’ used by pilots for computing aircraft weight and balance before each flight is 6.7 lbm per gallon.
This gives the Quds-1 a total fuel capacity of about 320 lbm. As computed in the above tables for range, the Quds-1 is able to fly 1,200 km with a total fuel load of between 276 lbm and 310 lbm.
It should be noted that flying at even slower speeds than the two flight speeds computed here will result in even greater range. With 300 pounds of fuel, this missile with this engine should be able to fly 1,400 km or more, flying at a speed of about 375 mph [325 knots; Mach 0.5]. At this speed, dynamic pressure is only 358 lbf/ft^2 and requires only 79 pounds of engine thrust.
That is TWICE the ‘estimated’ range of 700 km widely cited in the media and attributed to ‘experts.’ No actual expert in aerodynamics and jet propulsion could possibly arrive at such a ridiculous figure. It would require an engine fuel consumption of DOUBLE that of the actual TJ-100 engine.
Let’s Get Technical About Jet Engines
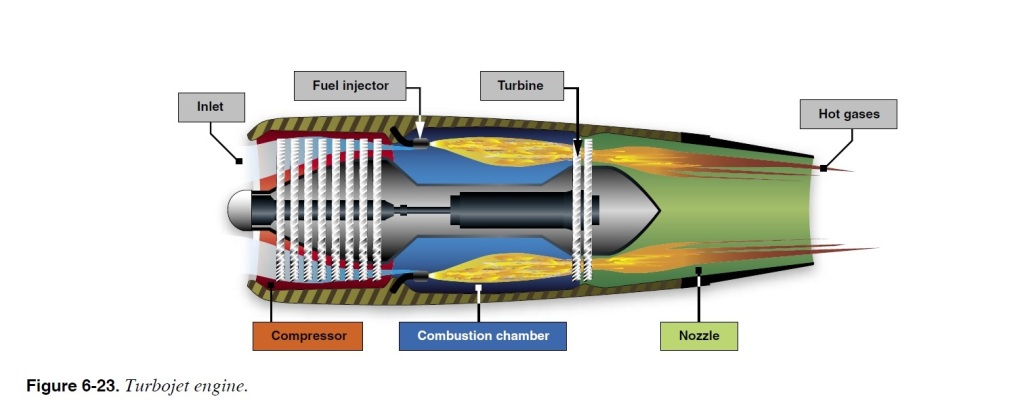
The layman reading this article may be wondering just how this concept of jet engine cycle analysis really works. It is not difficult to understand if we understand some fundamental mechanical facts about gas turbine engines. Let’s start with a cutaway illustration of a typical turbojet engine.
From the FAA Pilot Handbook of Aeronautical Knowledge
We see that the turbojet engine is really a fairly simple
device. There is actually only one moving part, the rotating assembly that
includes the compressor in front, the turbine in back, with both attached to a
common shaft. The entire assembly rotates at the same speed.
The functionality is simple: air enters the inlet and is compressed by the rotating compressor blades. The compressed air flows continuously from the inlet, through the compressor and through the combustion chamber, where fuel is added and burned, increasing the air temperature [which is now a gas composed of both fuel and air molecules.]
The flow continues steadily, without interruption, throughout the engine, from the combustor to the turbine, which is made to rotate by the hot gas flowing through its blades—in the same way a windmill or wind turbine is driven by air flowing through its blades.
The turbine, being connected by the engine shaft to the
compressor, provides the work required to turn the compressor and compress
the air before it enters the combustor.
After flowing through the turbine, the hot gases have lost some of their pressure and heat energy in driving the turbine—but there is still plenty of energy left to be squeezed through a jet nozzle that works in the same way as a simple water nozzle in your yard. The pressure energy in the gas [which was imparted by the compressor and only partially depleted in the turbine] is converted to kinetic energy, or speed energy, by being forced through a smaller opening.
The result is a very fast-moving stream of gas exiting the back of the engine, which, in turn, causes an equal force in the opposite [forward] direction, as per the physical reality of action-reaction.
This force is thrust, and
it is strictly a function of the mass flow going out that jet nozzle, and the
speed of the mass flow.
It’s important to pause here and point out a couple of important physical principles. The first is that the flow of air into the engine and out the nozzle is constant and without interruptions.
This means that the amount going in must equal the amount coming out, as per the conservation of mass principle. There is however, the added mass of the fuel to consider, so the jet exhaust mass flow is actually slightly in excess of the air intake mass flow of the engine [although this added mass is relatively small, since air to fuel ratios in jet engines are typically over 50 to 1].
Another important consideration is the physical fact that only pressure energy can be converted to work energy in any heat engine—this includes everything from a jet, to a car engine, to the refrigeration engine in your air conditioner.
That is why every heat engine must have a means of
compressing its working fluid. In jets, cars and any other air-breathing
engine, the working fluid is air—this is what must be compressed in order to have
a working engine.
The heat added in combustion by itself cannot do any work if
there is no compression, but it does allow the pressure energy to do MORE work,
since we have also added heat energy—thus the total energy of our fluid stream
is increased greatly.
Think of a balloon. If you inflate it, you have expended work energy to blow air into it. Once inflated it contains pressure energy that is capable of doing work. When you let go of the balloon lip, it performs work by exhausting a stream of air that propels the balloon around the room—physically a process identical to a jet engine.
If you were to use hot air to blow up that balloon [and if the balloon material could withstand the temperature], the amount of work released will be greater—and the balloon will jet around the room more energetically.
Understanding
the Turbojet Cycle
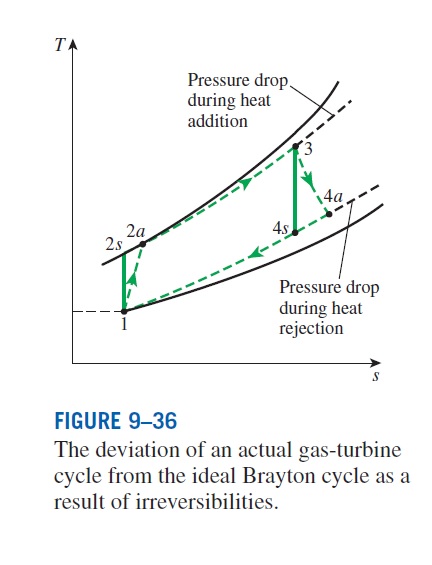
In the above diagram more detailed information is presented about what physically happens in each stage of the turbojet engine. [From Cengel; Thermodynamics: An Engineering Approach; 8’th Edition]
We note that the engine is divided into six ‘stations’ and
the corresponding temperature-entropy graph on the left shows what happens along
the way, as the airflow makes its way through the engine.
We note further that station 1 corresponds to the air just ahead of the engine, before it has even entered. If we imagine that jet engine moving through the air at a high speed we realize that as the air enters the engine and goes from point 1 to 2, it will be rammed into the engine, resulting in a compression of the air, as well as an increase in its density and temperature.
The chart on the left shows that at station 2, the
compressor face, temperature has already increased from the ambient air at
station 1—indicating the ram compression that has taken place. If we now refer
to our above tables of the cycle analysis for the TJ-100A engine in cruise
flight, we now can make sense of the parameters: Inlet pressure ratio;
compressor face temperature; total density; and dynamic pressure.
All of those values have increased from the condition
of the ambient air at station 1—all due to the speed of the engine hitting that
stationary air and packing it into its inlet due to the ram effect.
So before the air has even entered the compressor, we
already have some compression taking place!
We also note from the above cycle analysis tables that the mass flow of air is higher at the high-speed condition than it is at static: 1.98 kg/s at M 0.64, versus 1.85 kg/s at static. [In the slower flight condition at M 0.55 the airflow has decreased a little from static due to the fact that the engine rotational speed has been reduced substantially; the compressor simply cannot ingest a high airflow when it is rotating more slowly].
As the air moves through the compressor, we see a
significant temperature rise in the graph. This is due to the fact that
compressing air always raises its temperature. Now we refer back to the tables
and the parameter compressor outlet temperature, which is station 3 on
the engine.
The flow through the combustion chamber is from station 3 to 4. We see on the graph that heat is added [q in]. Thus our cycle analysis has computed a combustion temperature for each of the two flight speeds examined. This is a crucial aspect of the engine performance, since the amount of heat added in the combustion chamber is strictly a function of the amount of fuel burned.
Since the whole point of our cycle analysis has been to
compute the fuel consumption of the engine in flight, this parameter is key.
Another important point is that there is no increase in
pressure in the combustion chamber, despite the addition of heat. This is
fundamentally different from a car engine with which most people are familiar,
where the combustion of the fuel greatly increases the pressure in the cylinder.
The difference is that a car engine cycle is a stop and go process, with four distinct piston strokes, unlike the jet engine where the flow is constant and the engine is open at both ends at all times. The car engine cylinder closes its valves when the spark is ignited and combustion occurs, greatly increasing the pressure in the cylinder.
It is this closed volume that is absent from the jet engine, and hence the pressure throughout the combustion chamber remains the same, as seen in the graph on the left [P = constant].
The combustion that happens in the jet engine burner does result in an acceleration of the gas flow, due to the heat, but since the back of the engine is open there is no physical means by which the pressure can increase. In fact, the pressure in the gas turbine combustor will always decrease by a small amount, due to the inevitable physical losses in this process.
This is why our cycle analysis table has the parameter ‘pressure recovery,’ which in this case is 0.95, or 95 percent—meaning the gas flow has lost five percent of its pressure on its way from the compressor through the burner.
Also worth noting here is that once the gas turbine engine
combustor has been ignited, the flame burns continuously—just like your house
furnace. A spark is only needed to start the engine.
We note on the graph that the engine temperature reaches its
peak at the combustion chamber. From there the flow enters the turbine at station
4 and we see the temperature going down as work energy [both heat and pressure]
is extracted by the turbine.
At the turbine exit point, station 5, the gas flow has lost about half of its temperature, as we see in the graph—the remaining pressure and heat energy is expended in the nozzle, which does the work of accelerating the jet flow to a very high speed. We note from our cycle analysis tables that this exhaust jet speed for the TJ-100A at static condition is nearly 600 meters per second, which is over 1,300 mph!
That’s an impressive blast from an engine weighing less than
50 pounds.
So that is the thermodynamic cycle of the turbojet engine
explained. We can see that, knowing the basic engine parameters provided by the
manufacturer [static condition], it is a straightforward method to compute the key
unknown parameters [like combustion temperature and the various efficiencies at
the six engine stations].
Once we have computed the unknown parameters with a close match to the key published data points like thrust, specific fuel consumption, mass flow and turbine outlet temperature, we then proceed to take that static condition baseline and compute the same parameters [plus a few more] for the engine in flight.
Now looking at the parameters for the engine at its two respective
flight speeds, a question may arise as to why the compressor pressure ratio has
decreased, as compared to static.
The first reason is that in cruise, the engine is running at
a slower rotational speed, N. The compressor’s performance is based on how fast
it is spinning—the faster it spins, the higher the compression. If you slow
down the engine rpm, the compressor will not compress as much.
A second and important reason also comes into play, and that is the temperature of the air entering the compressor. We have noted already that at high flight speeds, the air is compressed in the engine inlet and its temperature has increased from ambient to station 2 on the compressor face.
The basic physical principle at work here is that hotter air requires more work to compress. The opposite is true of colder air. In jet engine design, this can be precisely calculated by means of something called the corrected shaft speed.
This means that if the air entering the compressor is hotter, the compressor will perform as if it is spinning at a slower speed. [The opposite is true of colder air, which is why jet engines get much more efficient as they climb to the high flight levels where the air temperatures are usually about 50 degrees below zero.]
In the case of a cruise missile flying low, the air entering the compressor is quite high at these high flight speeds. Our tables show a compressor face air temperature of close to 40 C [from a starting point of ambient temperature of 15 C; if the actual ambient temperature is higher than this standard ISA temperature, then the compressor face temperature will be higher still.]
Combined with the reduced engine speed to begin with, plus the even lower effective engine rpm due to the hot air at low altitude, the result is a drop in compressor pressure output.
However, we recall that at these high speeds the ram pressure is already substantial [about 1.3 pressure ratio in the case of the M 0.64 flight speed], so the overall pressure ratio [OPR] is the compressor pressure ratio multiplied by the ram pressure ratio, which equals 4.9. At the slower flight speed we see OPR of only 4.2.
This is a good time to note that a gas turbine engine’s efficiency is determined in large part by its pressure ratio—the latest large turbofans used on passenger jets have OPR of 50 or even higher.
Thus we see that in flight, the exhaust gas velocity also goes down, as the OPR declines. This is directly related to the lower pressure—we recall that only pressure energy can be converted to work energy in a heat engine…remember the balloon, blow it up harder and it will zoom around a lot more energetically.
Component
Efficiencies: The Final Piece of the Puzzle
We have to this point explained many of the parameters of the turbojet cycle and how they may be analyzed. But a number of the parameters, such as compressor and turbine efficiency, and pressure recovery in the inlet, combustor and nozzle have not.
The above graph shows what is called an ideal engine cycle, where each of those components is operating at 100 percent efficiency, with zero losses. This is not true in the physical world.
In this graph we see the effect of what are called irreversibilities in the Brayton cycle on which all jet engines, and gas turbine engines, generally, operate.
The horizontal line represents entropy, which are losses in efficiency, and we see that from point 1, which is the compressor in this generic gas turbine representation, the dotted line veers to the right, meaning that some work energy in the compressor is wasted. This wasted energy manifests itself as heat, which is why the point 2a, which is the end of the compression stage, is higher on the temperature scale [a stands for ‘actual’].
After the compressor, the line from point 2 to 3 is the
combustor, and we see a loss of pressure in the combustor, as mentioned
previously.
The turbine work from point 3 to 4 also veers to the right,
and the ending temperature of the turbine stage is higher than ideal [s stands
for isentropic, or lossless]. This means that not all of the heat energy
has been utilized for useful work—some is left behind and goes out the exhaust
pipe unutilized.
We also see that there is a pressure loss during the heat
rejection, where the cycle goes from its ending point at the exhaust [4a], to
its beginning point back at 1, the compressor inlet.
In our cycle analysis this pressure drop in the exhaust
nozzle is given as the parameter ‘nozzle pressure recovery.’
The total work of the engine is represented by the area
bounded by the lines, so we see how the irreversible losses shrink the area on
the graph and decrease the efficiency of the machine.
The various component efficiencies computed in the above cycle analysis for the TJ-100 represent fairly typical values for a small turbine engine: compressor and turbine efficiencies on the order of about 80 percent, and inlet, combustor and nozzle efficiencies on the order of the mid-90 percent range.
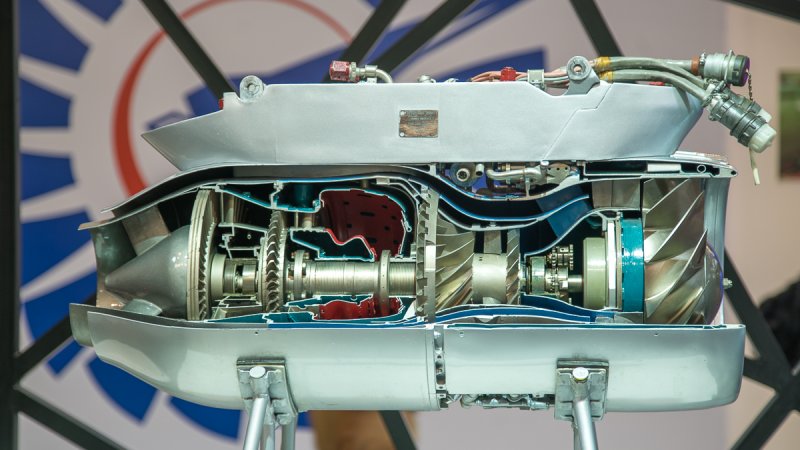
A closer look at the TJ-100 Engine
In the manufacturer’s data sheet, the engine is described:
TJ 100 is single-shaft engine with single-stage radial compressor, annular combustion chamber, single-stage axial turbine, and stationary exhaust jet.
A single-stage radial compressor, also known as a centrifugal
compressor is basically a turbocharger impeller.
These centrifugal compressors are widely used in small gas
turbine engines, including small aircraft engines—turbojets and turbofans for
light executive jets; turboprops for utility aircraft and turboshafts for
helicopters.
In reference to the illustrations of the turbojet engine
above, the axial-flow compressor with multiple compressor wheels is replaced
with a single centrifugal wheel.
As regards the turbine, we note that there is only a single turbine wheel of the axial flow variety, rather than the multiple stages shown in the above illustrations. The reason is that with its single compressor and relatively low pressure ratio, there is no need for a second turbine stage.
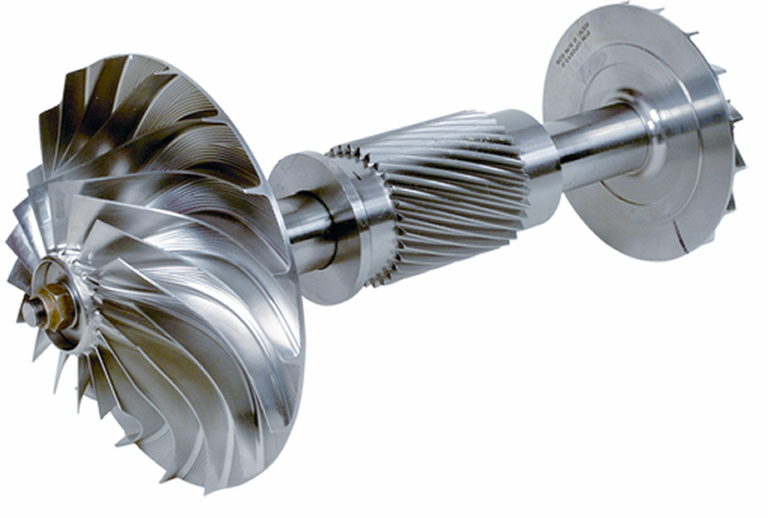
The entire rotating assembly of the TJ100 will look something like this:
The gear in the middle of the shaft would be used to drive the engine fuel and oil pumps and a generator. [This rotating assembly appears to use a radial-flow turbine wheel, as used on turbochargers].
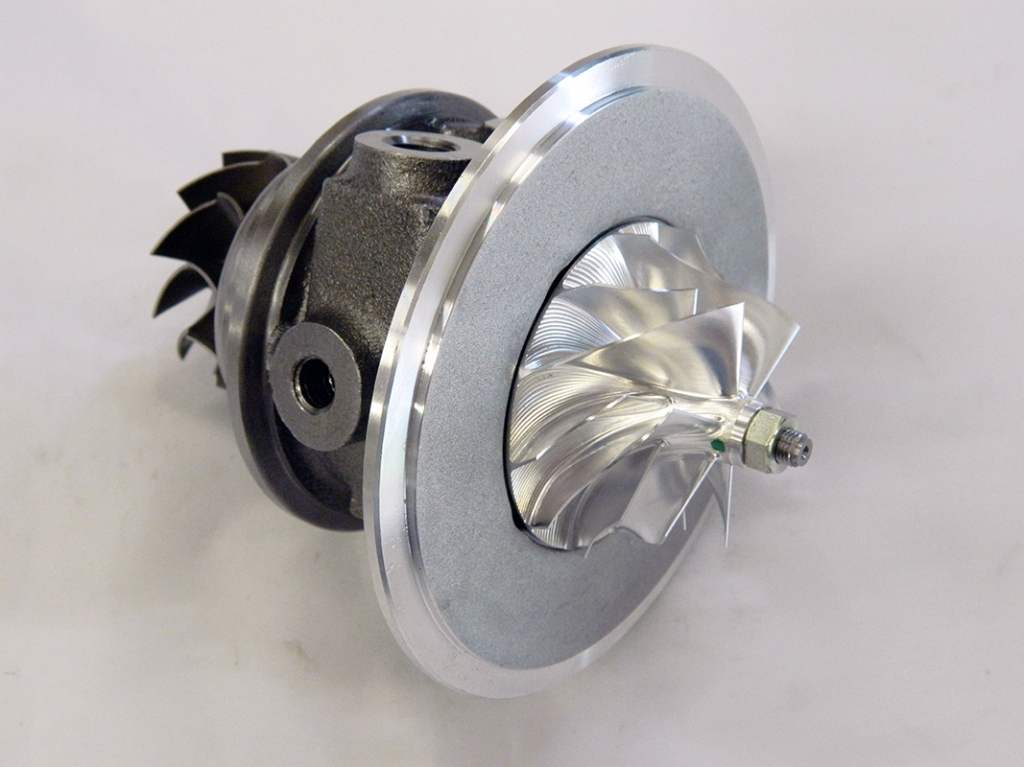
Basically the TJ-100 engine is not much more than a turbocharger core with a burner and a jet nozzle. Here is a turbocharger rotating assembly, inside its center housing:
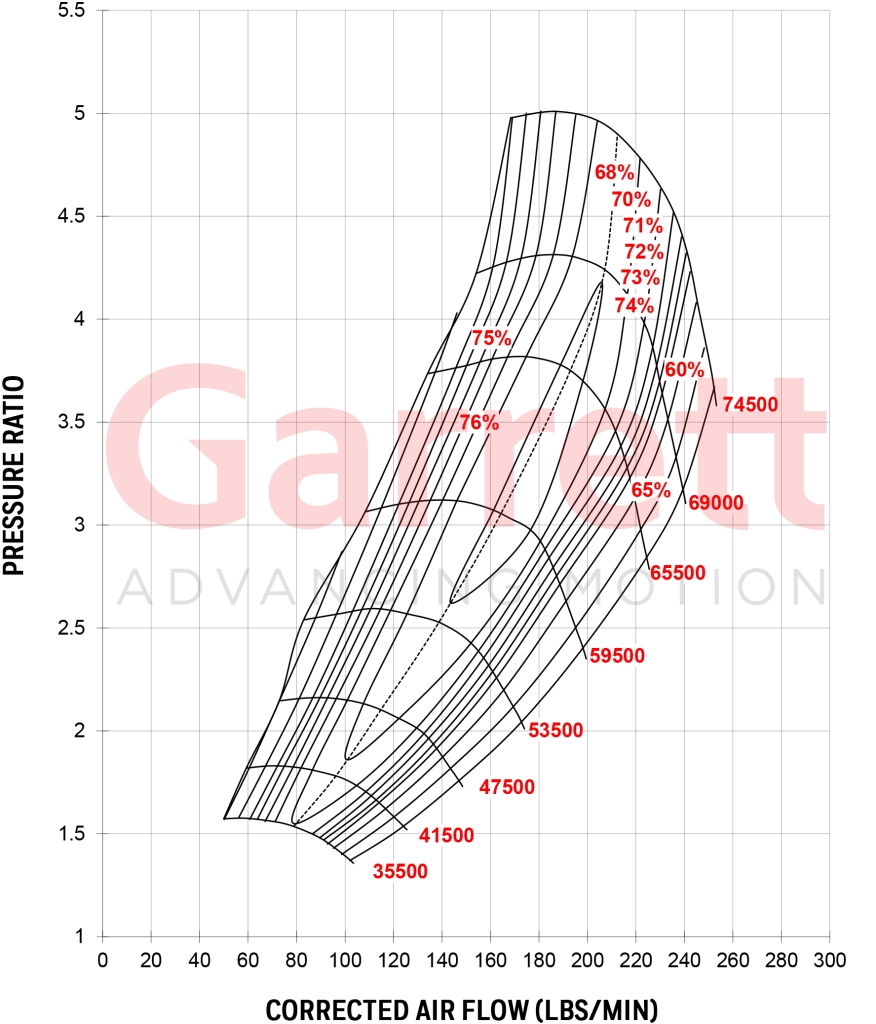
Here is a compressor map for a large performance turbocharger for car engines.
We note that at a pressure ratio of 4, it has an adiabatic efficiency of 77 percent, and flows 200 lbm/min, which is 1.5 kg/s—not much less than the compressor on the TJ-100. In fact there are bigger turbos with higher pressure ratios and mass flows than the TJ-100.
So we see that the TJ-100 is a very simple and basic design, that weighs only about 50 lbm. The small Williams turbofan used on the Tomahawk weighs nearly three times as much, for a thrust output that is only a little more than double.
The
Turbofan Engine
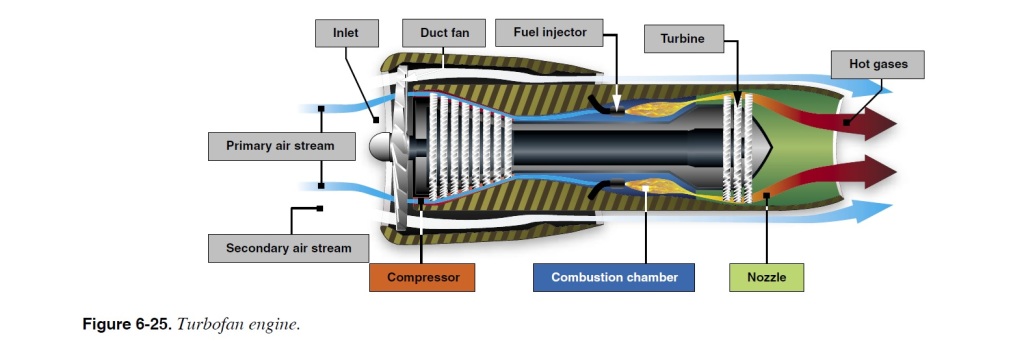
Here we see the inner workings of the turbofan engine. We notice it has two rotating assemblies, one for the fan, driven by its own turbine at the very aft end, and one for the ‘gas generator’ or engine ‘core’ which is basically the same as the turbojet engine.
The two assemblies, called spools, rotate independently of each other, with the fan spool shaft passing concentrically through the larger core shaft.
Naturally, this type of engine is a lot more complex mechanically. With very large fans and high bypass ratios that we see on modern passenger jet turbofans, the fan turbine stage may have as many as five turbine wheels.
Here is a cutaway of a small turbofan used on Russian cruise missiles.
We see that the flow splits off into two separate passages
just aft of the fan, with the core flow going into first a small, single radial
flow compressor wheel and then into a centrifugal impeller like we see on
turbos and small gas turbines like the TJ-100.
At the turbine section, we see one turbine wheel for each of
the two spools, with the concentric shafting clearly visible.
This is a low-bypass ratio engine—we can see clearly that
the ratio of the bypass opening is about the same size as the core duct,
implying a 1 to 1 bypass ratio [as on the Williams F107].
The advantage of the turbofan is that it moves a greater
mass of air—the cold stream from the bypass duct, and the hot stream from the
core. This means more thrust since thrust is the product of mass flow and exhaust
velocity.
At subsonic speeds turbofans have an additional advantage in
propulsive efficiency, since it is more efficient to move a greater mass of
air, at a slower exhaust speed, than a smaller mass at higher exhaust speed
like the turbojet.
However, at supersonic speeds the turbojet regains the advantage. The Concorde used Olympus turbojet engines to cruise without reheat [afterburner] at Mach 2. It had better fuel efficiency than the Tupolev Tu-144 which used turbofans—but later switched to the Kolesov turbojet engines when those were developed, and saw a substantial increase in fuel efficiency and range with the turbojets.
It’s worth noting that the new generation Russian Kalibr
cruise missiles use turbojet engines, not turbofans, and they have range
matching or exceeding that of the T-Hawk.
In looking at our cycle analysis it is clear that the TJ-100
engine is not optimal for a high-subsonic cruise missile flying low. A turbojet
for this flight condition would be more efficient with a higher pressure ratio,
perhaps six or seven—which is doable with a single centrifugal compressor.
That would bring the exhaust gas velocities to a higher speed in flight at Mach numbers over 0.5. Engine fuel efficiency would increase with the higher pressure ratio.
However, the TJ-100 is capable of doing the job as our cycle analysis indicates.
A maximum range of 1,400 km is entirely possible with the Quds-1 missile. It should be noted that the range numbers attained in this analysis could in fact be higher if the Quds were to fly some portion of its en route flight at a higher altitude—even at 1,000 ft the numbers would be better.
There is no doubt whatsoever, that the Quds-1 powered by the TJ-100 engine is indeed capable of hitting the Saudi oil facilities at Abqaik. The ‘experts’ who claim otherwise are actually nothing of the kind.
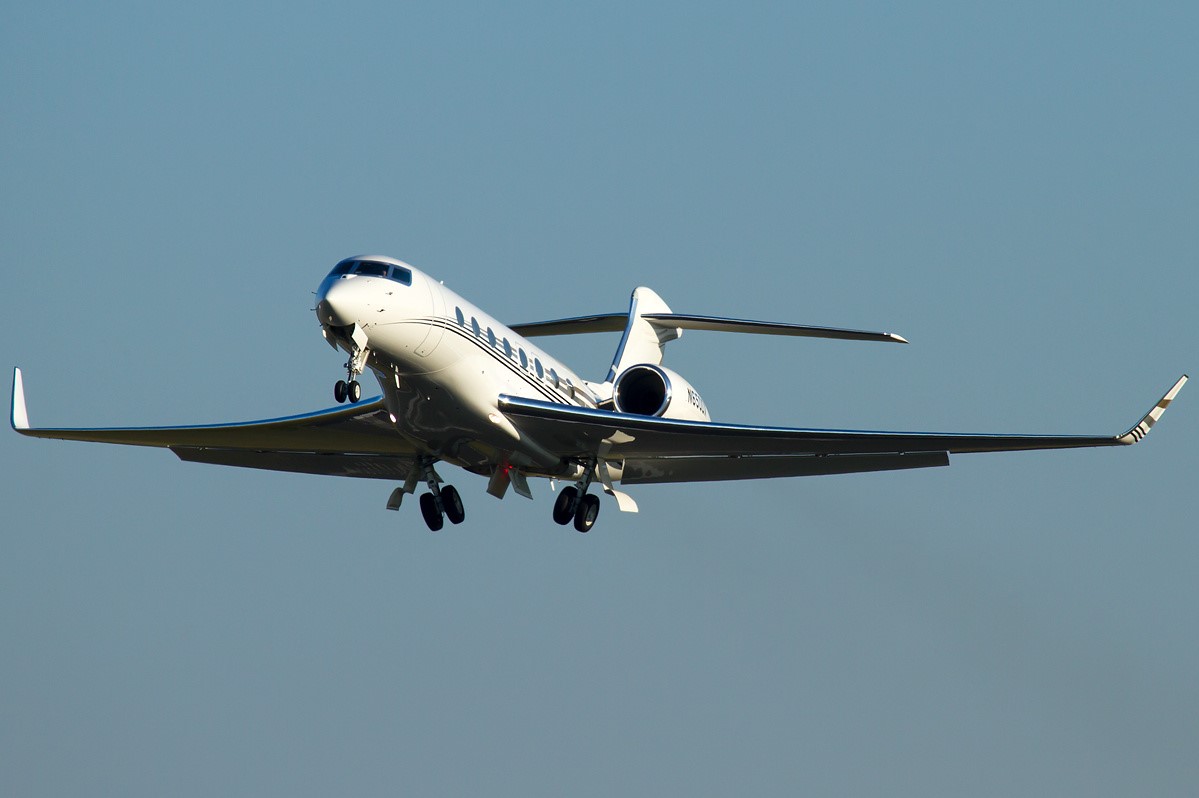
Here is a Gulstream G650 bizjet pulling up its landing gear as it climbs
out after takeoff. This airplane provides a fantastic flying experience
to the lucky few that can afford its $70 million price tag. Or to the
pilots that get to fly it…
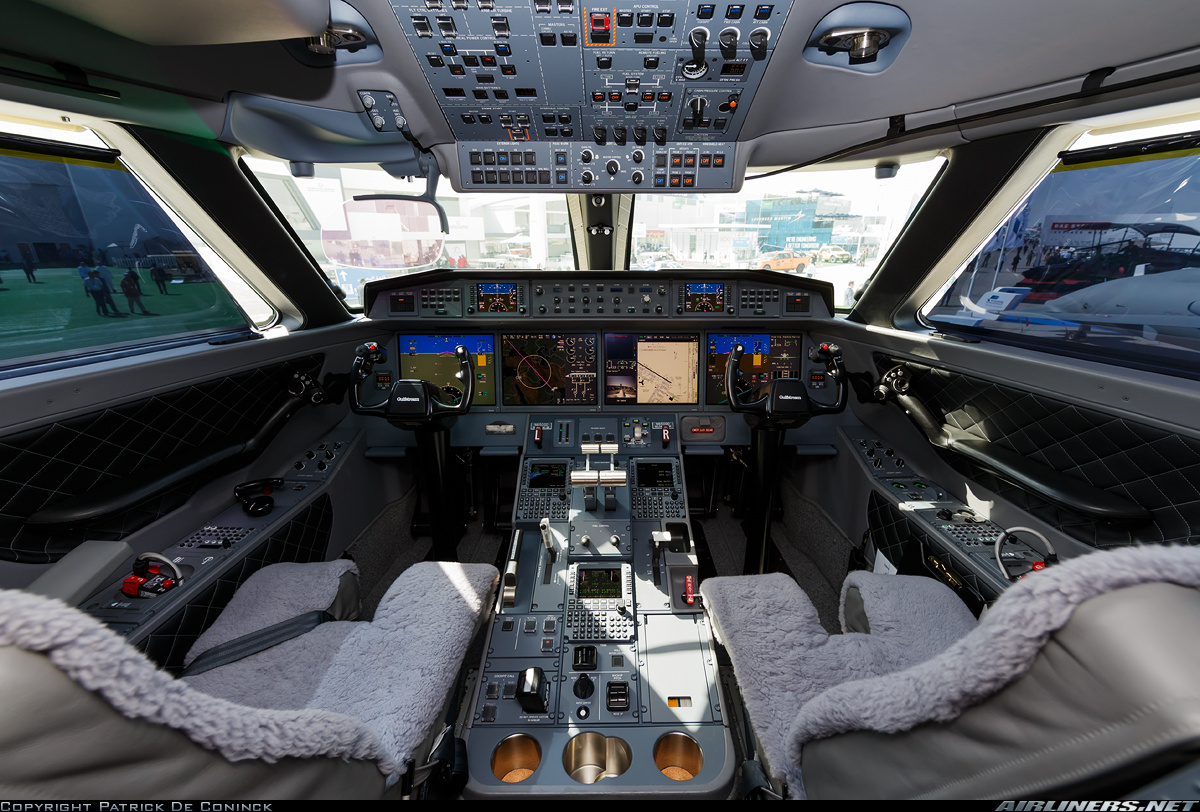
G650 Flight Deck
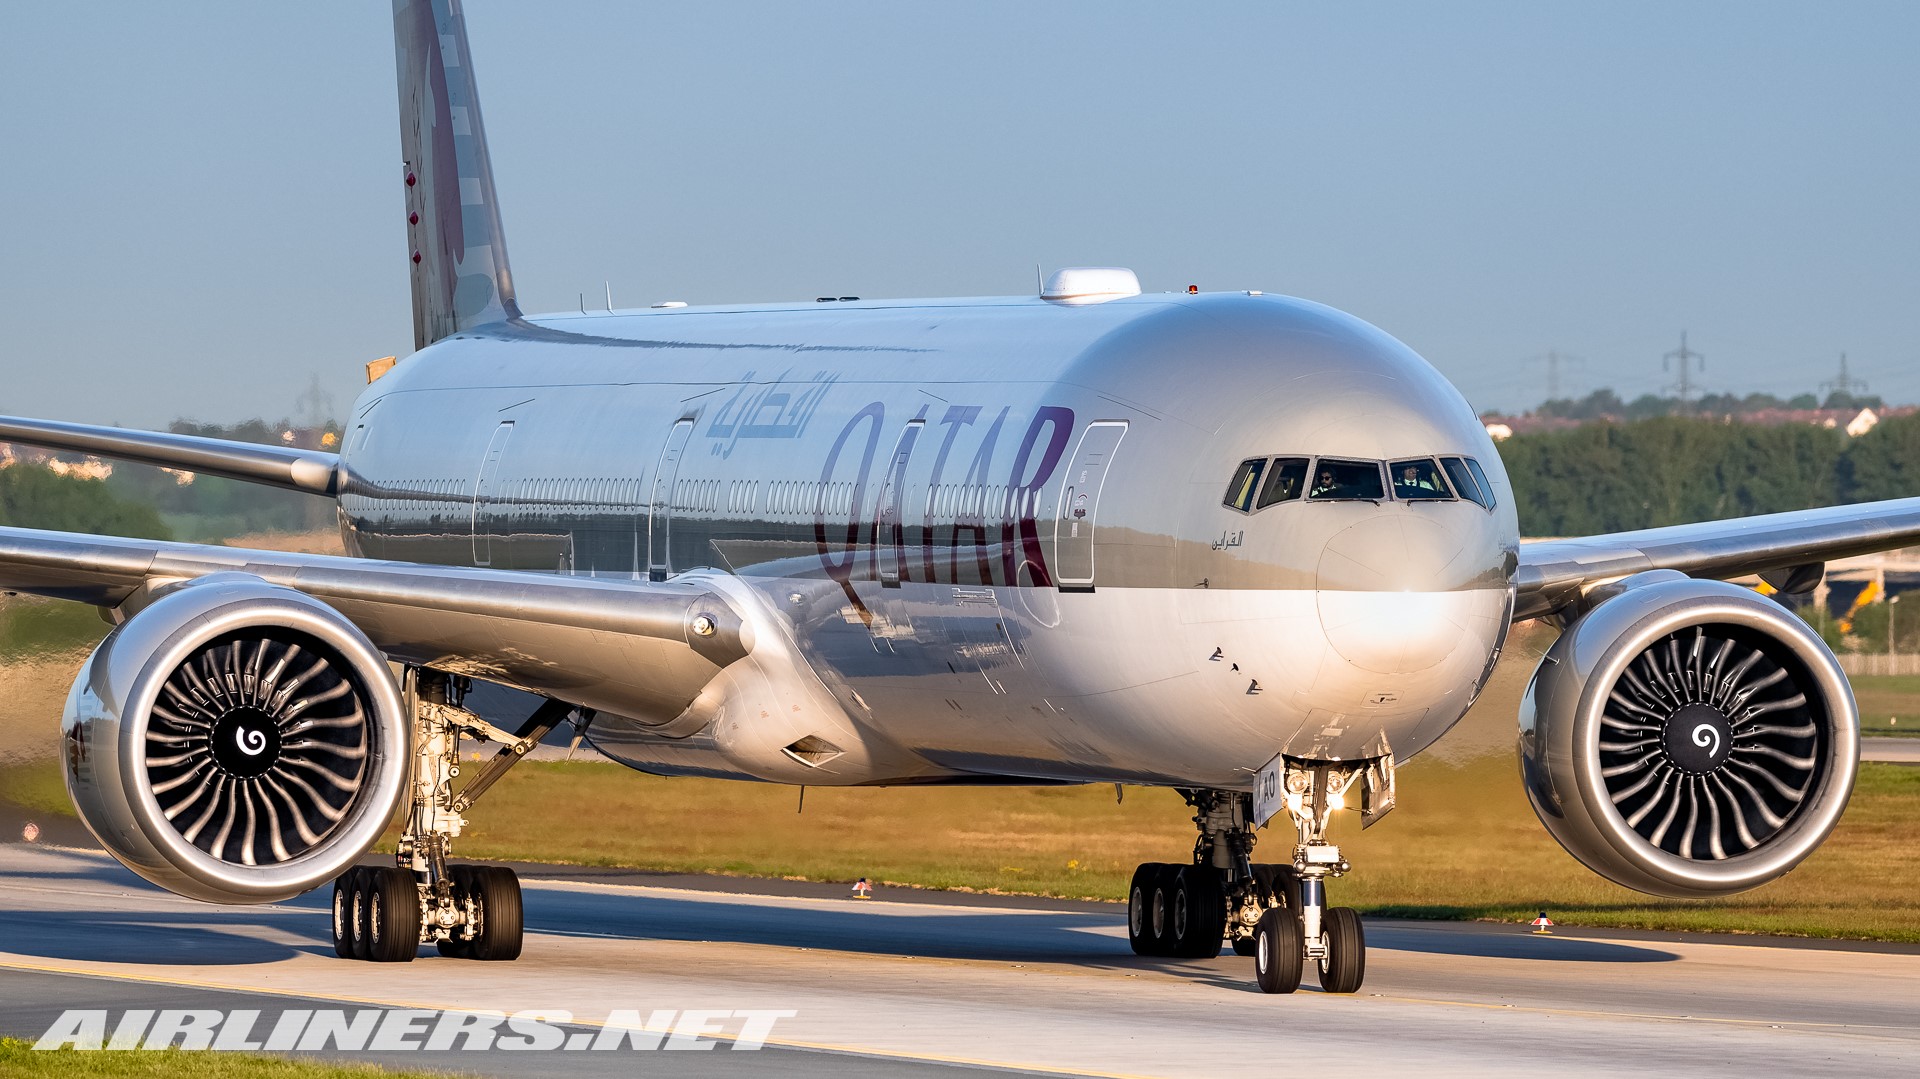
But even if you don’t get to fly on a super long range bizjet [the G650 has a maximum range of 7,500 nautical miles, which is nearly 14,000 kilometers, which works out to about 15 hours flying time!] you can still get to fly on an incredible machine like the Boeing Triple Seven…merely for the price of an airline ticket.
Boeing 777
Now we all love flying on these amazing sky machines and some of us are even lucky enough to ‘drive’ them–let’s face it, flying never stops being fun. For some of us this fascination with flying machines is so overpowering that we constantly look for more information, always curious to learn more about how these machines actually work and what it takes to fly them.
That’s what we are going to do here. Ever wonder just how much horsepower those engines on that big triple seven are putting out? Well, any ‘knowledgeable’ aviation enthusiast will tell you that jet engines make thrust, not horsepower, but this is not really true at all! The fact is that things like ‘power’ and ‘thrust’ are in fact pretty much interchangeable when it comes to physics.
Let’s say we are cruising at the airplane’s typical cruise altitude of
35,000 feet and cruise speed of 550 mph [Mach 0.83]. The airplane’s pair
of GE engines are putting out 17,500 pounds of thrust each, for a total
of 35,000 pounds of force. Now, knowing the airplane’s speed, and its
thrust, we can find out its power, which is defined as force times
velocity. Therefore we multiply 35,000 lbf [pounds of force] times 808
feet per second [that’s 550 miles per hour, but it has to be in ft/s for
the math to work out neatly] and get 28,280,000 ft*lbf/s. Now you may
be wondering what exactly is ft*lbf/s, and that will be explained in the
sidebar, but for now it is relevant that there are 550 of them in one
horsepower…so to get the horsepower of those two engines, we divide
28,280,000 by 550 and get about 51,000 hp.
That means that each engine is putting out over 25,000 hp, about 100
times as much as your car or truck engine may be capable of at full
power and with the pedal to the metal.
Boeing 777-200 ER lined up on runway, ready to begin takeoff roll!
Now what about the power to weight ratio? The GE90-85B engines on the ‘dash 200’ extended range model of this airplane weigh about 16,000 pounds each. Your car engine making 250 hp might weigh more like 500 lbs, so 100 of those equaling the power of one triple seven engine would weigh about 50,000 lbs–more than three times as much!
And what about fuel economy? These turbofan engines have a thrust specific fuel consumption of 0.52 in cruise, which means they burn about half a pound of fuel for each pound of thrust they produce, per hour. Since each engine is making 17,500 lbf of thrust, it means each is burning 9,100 pounds of fuel per hour. There are about 6.8 lbs in one gallon of Jet-A aviation fuel, so that works out to just over 1,300 gallons per engine, per hour. Since the airplane is flying at 550 mph and the two engines are going to burn roughly 2,600 gallons in that one hour, it means the airplane is getting five gallons per mile. Not five mpg, mind you, but 0.2 miles per gallon.
Now that may sound like terrible fuel mileage, but consider that this is one huge flying machine–carrying 300 souls and weighing more than half a million pounds [that’s over 250 tons]. It’s two thirds the length of a football field and its tail is as high as a six story building…and the whole thing is moving through the earth’s atmosphere at 550 mph!
But just for comparison sake, how does it stack up to let’s say a
Bugatti Veyron, which has a top speed of about 250 mph, less than half
the triple seven’s cruising speed, and it gets 2.3 mpg when running at
full speed. So the triple seven is using only as much fuel as 10
Bugattis going at full speed! That’s actually pretty incredible, because
the Bugatti has 1,000 hp, but the GE turbofan engine is putting out 25
times as much, which means the jet is two and a half times as fuel
efficient. So we see that today’s jet aircraft aren’t really fuel
guzzlers at all, even when compared to cars.
Let’s look at it a different way. Suppose you and a friend went on a road trip of 1,000 miles. If your car gets 25 mpg, you would use 40 gallons, and if there are two of you, then that is 20 gallons for each person for the trip, or 50 mpg, per person. That triple seven can carry 300 people for let’s say 5,000 miles and will burn about 25,000 gallons. That is a fuel mileage of 300 x 5,000 / 25,000 = 60 mpg, per person…even better fuel economy than a road trip with a friend, in a fairly fuel efficient car. There is also the time factor. A road trip of 1,000 miles may take 15 or more hours, depending on traffic and speed limits. The triple seven will complete a trip almost half way around the world in that amount of time.
GE90 turbofan engine
But let’s dive a little deeper into the technical details. Any two types of engines can be compared by a measure called thermal efficiency. This tells us exactly what percentage of the chemical energy contained in the fuel is actually converted into useful work by the engine–which is the power or thrust that the engine makes. One pound of jet fuel contains 18,400 BTU of energy [42.8 megajoules per kg in metric], so that GE90 engine burning 9,100 lbs per hour is burning 167 million BTU per hour [BTU stands for British Thermal Units], or 46,500 BTU per second . Now we know that one horsepower is equal to 1.415 BTU per second, so we simply need to convert our horsepower to BTU/s and divide our total BTU being burned in order to get our thermal efficiency. Since 25,400 hp equals 18,000 BTU/s, it means that our thermal efficiency is 18,000 / 46,500 = 0.39, or nearly 40 percent!
How does that compare to the Bugatti? Let’s crunch the numbers and find out. The Bugatti is making 1,000 hp at its top speed of 250 mph, and it is getting 2.3 mpg so that means it would use roughly 110 gallons to drive one hour at its top speed [250 / 2.3 = ~110]. Gasoline weighs 6 lbs per gallon, so that is 660 lbs of fuel in one hour, to make 1,000 hp. That’s a brake specific fuel consumption of 0.66, which means it takes that many pounds of fuel to make one hp, for one hour, in that turbocharged W16 engine. Since there are about 19,000 BTU in each pound of gasoline it means the total energy used is 3,500 BTU per second [19,000*660/3600 seconds per hour = ~3,500]. The engine’s 1,000 hp equals about 700 BTU/s, so the thermal efficiency is 700/3,500 = 0.2, which is 20 percent…half as efficient as the big jet engine.
Many aviation enthusiasts and even some pilots may be surprised at how efficient today’s jet engines really are. In future articles we will look more closely at what’s going on.
Let’s Get Technical
Let’s explain some of the science that we just talked about. In working out the triple seven’s horsepower we mentioned that power = thrust x velocity. Here is how that works. First let us understand the concept of power, which in its most basic sense can be described as work performed over time. If you lift a 100 pound weight one foot off the floor you have performed 100 feet*pound force of work [the * symbol is a multiplication sign, ie ‘times’]. That’s because work is defined as force * distance. Weight is a force and is multiplied by the distance in the number of feet by which you moved against that force; hence ft*lbf, the basic measure of work in the English system of units [in metric it is the newton*meter].
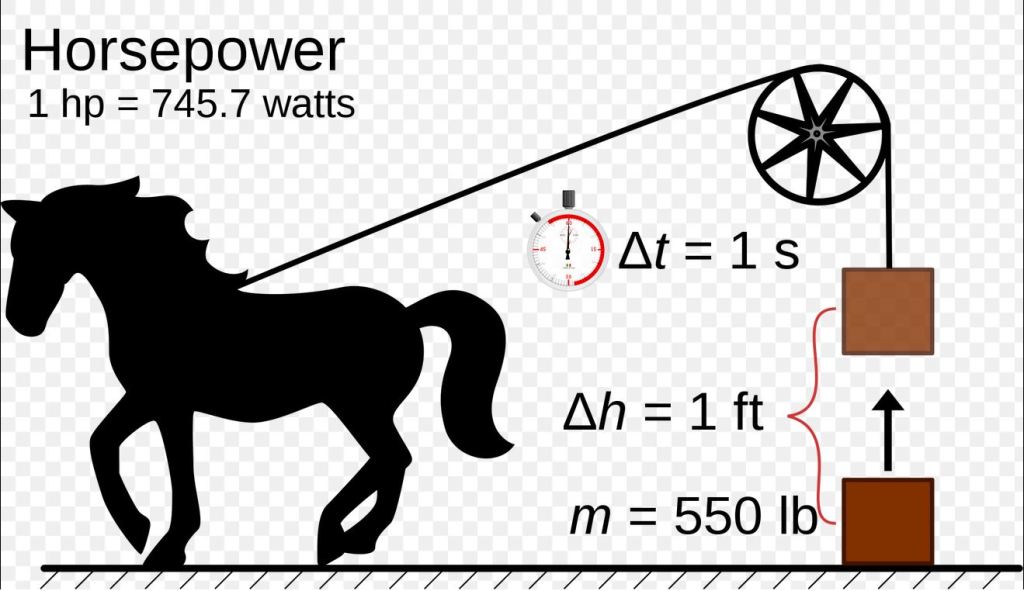
Power is simply the rate at which work is performed. If you are able to lift that 100 lbf weight by one foot, once every second, then you will be putting out a power of 100 ft*lbf/s. If you are strong as a horse, you could lift a 550 pound weight at a rate of one foot per second, which is a power output of 550 ft*lbf/s–exactly one horsepower. That observation on the work capability of horses came from James Watt, a Scottish engineer in the late 18’th century. He found this by observing draft horses pulling big pails of water out of mine shafts. The measure of power in the metric system, the watt, is named after him.
A horse can pull 75 kg per meter per second, which is the same as 550 lbf per ft, per second
But how does this explain that we got our airplane’s horsepower by multiplying its speed times its thrust? Well, we recall that thrust is a force, like weight…and velocity is by definition distance divided by time. So we moved an airplane with a thrust force measured in pounds, by a distance measured in feet, per unit of time measured in seconds…which is exactly what that horse is doing in the illustration above! Our amazing triple seven airplane is really nothing more than a good old horse, as far as the laws of physics are concerned.
Don’t be like this guy…get your head out of your phone and up into the sky!